














Full-Stack Observability
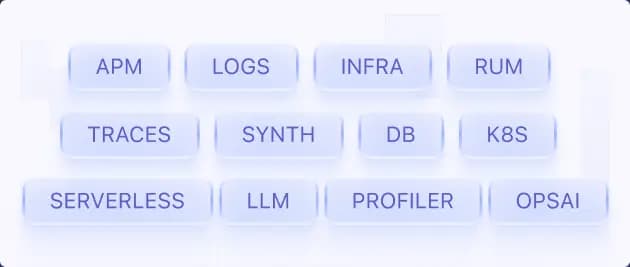
APM, Infrastructure, Logs, Distributed Tracing, RUM, Synthetic Monitoring, Databases, Containers, Kubernetes, Serverless, and LLM Observability. If you can monitor it in Grafana, you can monitor it here.
- Every pillar included, one plan
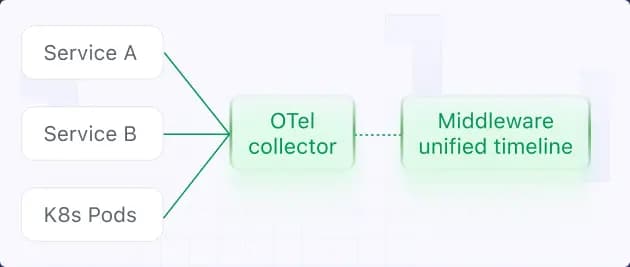
- OpenTelemetry-native, not bolted-on
- OpsAI included, not a per-host add-on
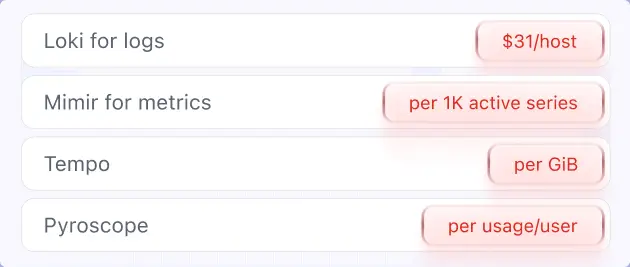
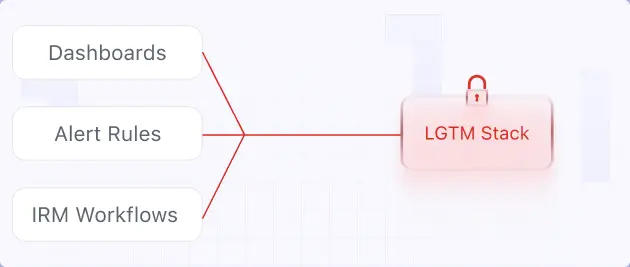
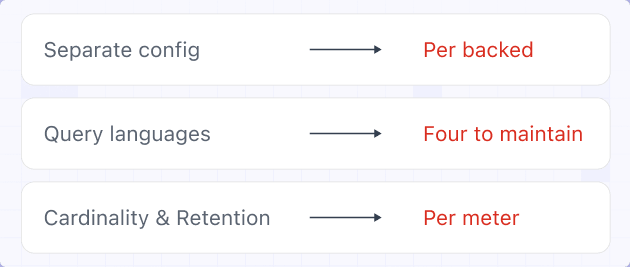
Loki for logs, Mimir for metrics, Tempo for traces, Pyroscope for profiling, plus k6, IRM, and Grafana Assistant. Four backends stitched at the dashboard layer.
- Four separately billed backends
- Four query languages (LogQL, PromQL, TraceQL, profile)
- Grafana Assistant billed per active AI user