









The Better Coralogix Alternative
Full-Stack Observability with an SRE Agent Built In

Tired of Streama priority tiers, TCO Optimizer policy maintenance, and a log-first architecture that never quite feels unified? Switch to Middleware, an OpenTelemetry-native observability platform with predictable pricing, one-minute setup, and OpsAI โ€” an SRE Agent that ships the fix as a pull request.

Trusted By The Best Teams From

Why You Should Replace Coralogix with Middleware

Full Feature Parity

APM, infrastructure, logs, distributed tracing, RUM, synthetics, databases, containers, Kubernetes, serverless, browser testing, and LLM observability all bundled in one platform. Every signal is searchable, correlated, and priced consistently.

  • Every observability signal included in one platform
  • Unified timeline across logs, metrics, traces
  • LLM observability and Session Replay included
  • One pricing model across every telemetry type
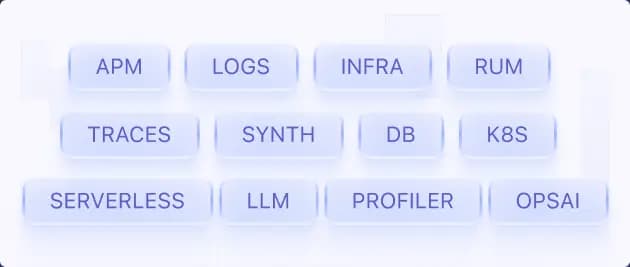
APM, infrastructure, logs, distributed tracing, RUM, synthetics, databases, containers, Kubernetes, serverless, browser testing, and LLM observability all bundled in one platform. Every signal is searchable, correlated, and priced consistently.

APM, infrastructure, logs, distributed tracing, RUM, and security monitoring are available, but telemetry is routed through the proprietary Streama engine and managed across Frequent Search, Monitoring, and Compliance tiers.

  • Routed through Streama's proprietary architecture
  • Data assigned to Frequent Search & Monitoring
  • Routing decisions affect search, retention & pricing
  • Additional features follow the same tier-based model
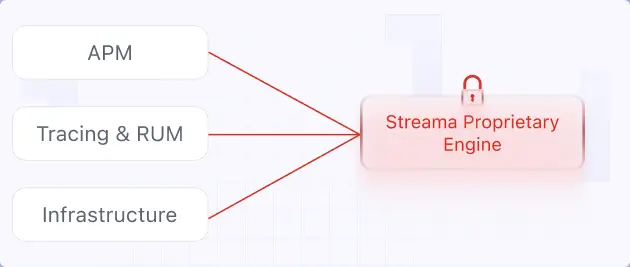
APM, infrastructure, logs, distributed tracing, RUM, and security monitoring are available, but telemetry is routed through the proprietary Streama engine and managed across Frequent Search, Monitoring, and Compliance tiers.

OpenTelemetry-native, not Streama-native

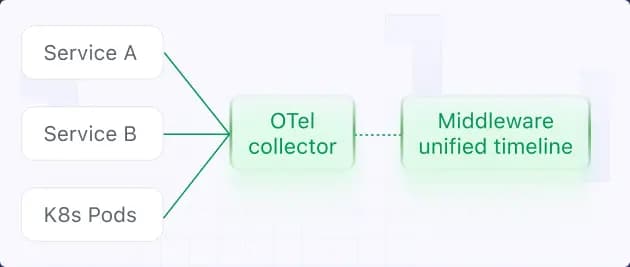
Built on OpenTelemetry from ingestion through visualization. Keep your existing instrumentation, collectors, and pipelines without translating telemetry into a proprietary backend or data model.

  • 100% OpenTelemetry-native architecture
  • Repoint existing OTel Collectors without code changes
  • Cloud, BYOC, hybrid, and on-prem deployments
  • Open dashboards and PromQL-based alerting
Built on OpenTelemetry from ingestion through visualization. Keep your existing instrumentation, collectors, and pipelines without translating telemetry into a proprietary backend or data model.

Coralogix supports OpenTelemetry ingestion, but converts incoming telemetry into its proprietary Streama engine. Dashboards, alerting, and pipelines become tightly coupled to the platform.

  • OTel data converted into the Streama data model
  • Proprietary dashboards and alert definitions
  • Migration requires rebuilding platform-specific assets
  • No on-prem deployment option

Cost control without the policy treadmill

Pay for the data you send with predictable pricing and simple controls to reduce telemetry volume. No routing rules, priority policies, or ongoing optimization projects required.

  • Predictable pricing based on data ingested
  • Two-click Ingestion Control for noisy telemetry
  • 180-day retention included
  • No per-host, per-user, or per-container fees

Coralogix provides flexible cost optimization through TCO Optimizer, but controlling spend requires maintaining routing policies, retention rules, and priority assignments over time.

  • Per-GB pricing split across multiple priority tiers
  • TCO Optimizer policies require ongoing maintenance
  • Unmatched data defaults to higher-cost storage tiers
  • Additional archive and cloud storage costs may apply

Unified observability, not logs-first

Logs, metrics, traces, infrastructure, and events share one timeline and one correlation layer. Investigate issues from any signal without switching between products or manually connecting telemetry.

  • Unified timeline across every telemetry signal
  • Automatic cross-signal correlation with OpenTelemetry
  • Native logs-to-traces navigation
  • LLM observability included at no extra cost

Coralogix expanded from log analytics into full-stack observability, but many workflows still revolve around log pipelines, storage tiers, and manual correlation for custom telemetry.

  • Log-first architecture with tier-based pipelines
  • Manual Correlation Mapping for custom fields
  • LLM monitoring billed separately
  • RUM follows the same pipeline model

Setup in minutes, not weeks

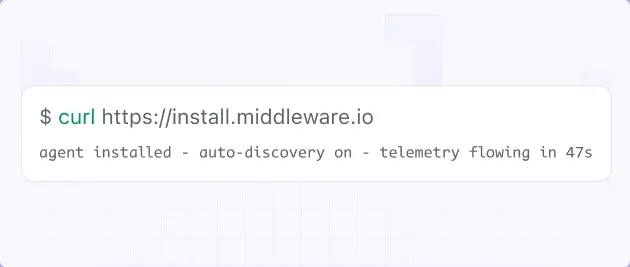
Install one lightweight OpenTelemetry Collector and start monitoring in under a minute. No pipeline design, proprietary query language, or complex onboarding required.

  • One-script installation
  • Automatic service and dependency discovery
  • Visual query builder with PromQL support
  • One-hour support SLA on every plan
Install one lightweight OpenTelemetry Collector and start monitoring in under a minute. No pipeline design, proprietary query language, or complex onboarding required.

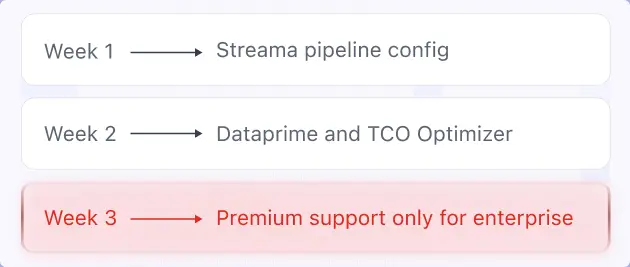
Getting full value from Coralogix typically means configuring Streama pipelines, learning DataPrime for advanced investigations, and maintaining TCO Optimizer policies over time.

  • Streama pipeline configuration required
  • DataPrime needed for advanced investigations
  • Ongoing TCO Optimizer policy management
  • Premium support available only on Enterprise plans
Getting full value from Coralogix typically means configuring Streama pipelines, learning DataPrime for advanced investigations, and maintaining TCO Optimizer policies over time.

Point your existing Coralogix alerts at Middleware & switch incrementally

The first observability platform built around AI,
not bolted onto it

AI Dashboards

Describe what you want in plain English. Middleware builds the dashboard, picks the charts, and writes the queries. No PromQL, no custom query language, no template gallery to comb through.

AI Alerts

Alerts that learn what "normal" looks like for each service and surface only the deviations that matter. Anomaly detection that doesn't drown your on-call rotation in noise.

OpsAI ยท SRE Agent

An AI SRE that pinpoints root cause, identifies the offending line of code, and opens a pull request with the fix while you're still reading the alert. Auto-resolves issues with 80% accuracy.

AI K8s Root Cause Finder

Auto-structuring, severity detection, and pattern recognition built into log ingestion. No manual regular expressions, no parsing pipelines to maintain.

Auto-Fix ยท 60% Time Saved

Auto-fix across infrastructure and application layers with 80% accuracy. Engineers spend 60% less time on issue resolution โ€” and the rest on shipping product.

Customer Stories

Aceturtle

Middleware has played a very good role in transforming our observability and application performance. For instance, we reduced our total observability costs by 50%.

Read the story

Vivek Gupta

Founder & CEO

Hotplate

We're heavy users of RUM and have tried many tools before discovering Middleware. We've been using OpsAI for the past few weeks, and it has automatically resolved about 60% of our production issues.

Read the story

Rangaraj Tirumala

Founding Engineer at Hotplate

MindOrigin

Compared to other observability solutions, Middleware offered similar or even superior capabilities at a much lower cost, eliminating the need for expensive tiered pricing or additional charges for advanced features.

Read the story

Krishna Charan BS

Security Head, MindOrigin

Feature-by-Feature Comparison: Middleware vs Coralogix

Evaluate for yourself. Here's how Middleware stacks up against Coralogix, capability by capability.

Bottom line

Teams wanting unified, OpenTelemetry-native observability

Teams invested in the Coralogix platform

Recommended for

Cost-conscious, OTel-native cloud teams

Teams willing to manage routing policies and Streama pipelines

OpenTelemetry-native

Built on OpenTelemetry

OTel ingest with proprietary Streama backend

BYOC / On-prem

Cloud, BYOC & on-prem

Limited (S3 archive only)

Value for money

2-click Ingestion Control

Tier-based costs increase with routing complexity

Pricing model

Pay for data ingested

Per-GB with Frequent Search, Monitoring & Compliance tiers

Cost control

2-click Ingestion Control

TCO Optimizer policies and routing rules

Per-host fees

None

None

Per-user fees

None

None

Data priority tiers

None

Frequent Search, Monitoring, Compliance

Query language

Visual UI, PromQL & SQL-like logs

DataPrime & Lucene

Unified observability

One timeline across all signals

Log-first architecture

Logs-to-traces correlation

Native via OpenTelemetry

Native via Coralogix agents

Search on all spans

Search every stored span

Depends on priority tier

LLM observability

Included

Separate AI token pricing

RUM & Session Replay

Included

Available through the same pipeline model

Data retention

180 days included

Tier-dependent + S3 Remote Query

Dedicated technical support

All plans

Real support, even on the entry tier.

Enterprise only

Premium SLAs and dedicated support reserved for Enterprise customers.

The numbers after the switch

Averages across customers who migrated from Coralogix to Middleware.

4ร—

Troubleshooting

Faster mean-time-to-detect with unified signals on one timeline.

50%

Cost Reduction

Reduction in observability spend versus Coralogix tier-based contracts

1hr

Issue response SLA

Critical-issue response SLA on every plan

80%

Auto fixes with accuracy

OpsAI resolves issues end-to-end, saving 60% of engineer time.

You Don't Have to Rip Out Coralogix on Day One

Already running Coralogix Alerts? Forward it to OpsAI and let it investigate & fix incidents against your existing stack without re-instrumentation

Zero Re-instrumentation

Incremental Adoption

100% Data Continuity

Read the Migration Docs

Email is required

Company name is required

Please enter monthly bill amount
Features Used in Coralogix
Minimum 3 characters required

Minimum 3 characters required

FAQs

Everything you want to know about the Coralogix Alternative

How is Middleware's pricing different from Coralogix's?

Both bill on data size with no per-host or per-user fees. The difference is what you have to do to keep the bill predictable. Coralogix relies on TCO Optimizer policies you configure and maintain. Middleware bills on what you send, with two-click drop rules if you want to cut volume further.

Do I still get cost control without TCO Optimizer?

Yes. Ingestion Control lets you drop sources, fields, and high-cardinality dimensions in two clicks. No policy maintenance required.

Is there a free trial?

14 days, every feature, no credit card.

Is Middleware OpenTelemetry-native?

Yes. OTel is the foundation, not a connector. No proprietary engine, query language, or pipeline syntax to learn.

Do I need to learn a new query language?

No. Most workflows don't require one. Coralogix needs DataPrime or Lucene for anything non-trivial.

What about long-term retention?

Middleware includes 180 days. Coralogix relies on archiving to your S3 bucket and using Remote Query, which is powerful but adds operational complexity.

Can I deploy on-premises or BYOC?

Yes โ€” cloud, on-prem, BYOC, or hybrid.

What happens to my Coralogix dashboards?

We help you rebuild critical dashboards in Middleware during onboarding.

Can I keep my existing OTel instrumentation?

Yes. Repoint your collectors at Middleware and ingest immediately.

Optimize More. Worry Less. With Middleware.