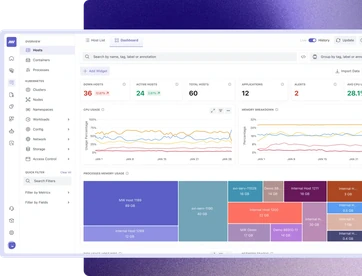
Get a complete system visibility without switching screens/tools
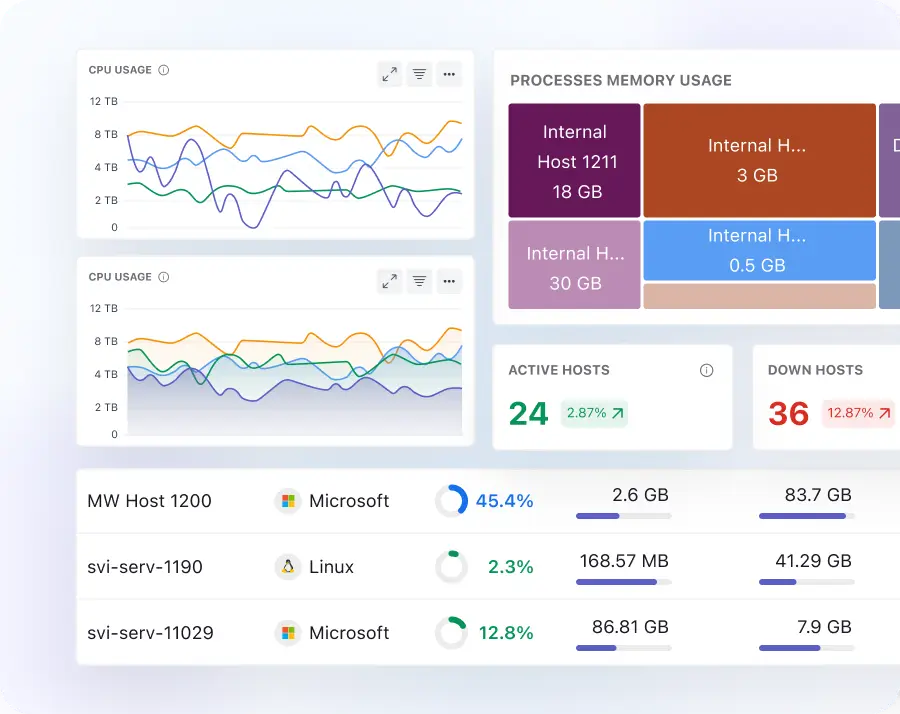
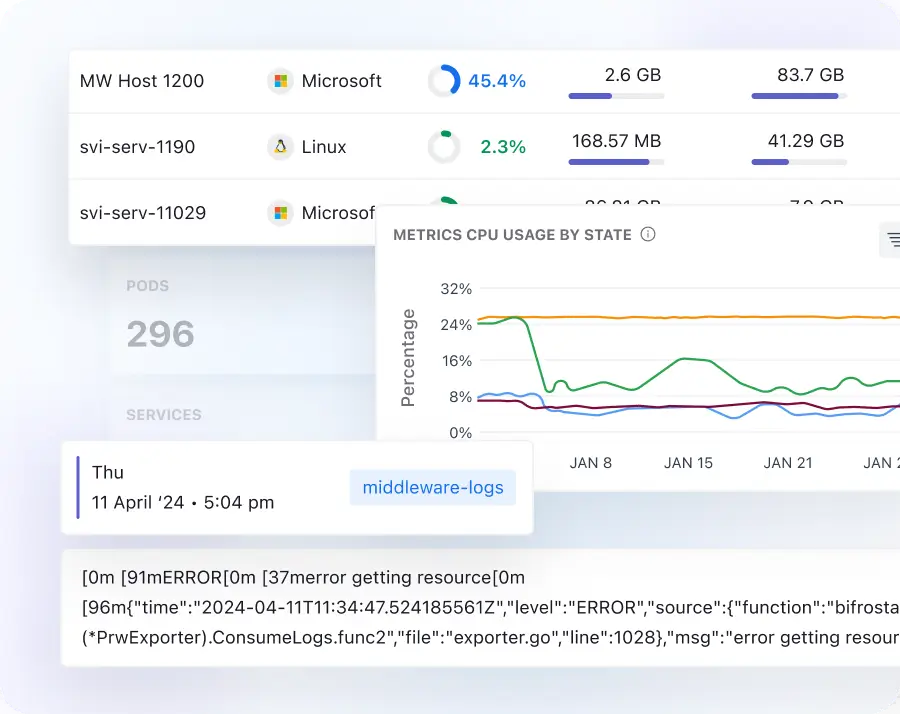
- Monitor hosts, containers, VMs, and cloud services in real time. View CPU, memory, disk, and network metrics across your entire fleet in one unified view.
- Move from detection to resolution faster with contextual infrastructure intelligence and correlations across metrics, traces, and logs, empowering your team to act proactively.
- Get a complete system visibility without switching screens/tools
- Map service dependencies and infrastructure topology to scope blast radius and prioritize mitigation the moment an incident is detected.
Effortlessly manage high-cardinality metrics
- Ingest high-cardinality telemetry across any label dimension, region, version, or namespace without hitting limits that reduce metric precision.
- Query real-time infrastructure metrics with sub-second response during live incidents, no stale dashboards, no query latency under on-call pressure.
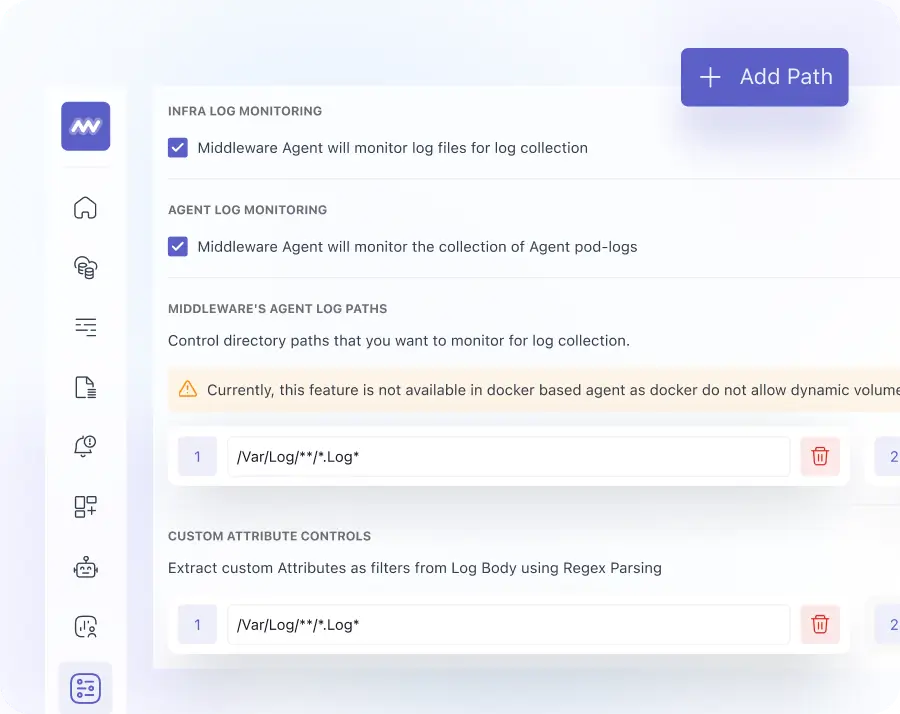
- Control ingestion at the metric level: toggle individual metrics on or off to reduce observability cost without creating blind spots in production.
- Effortlessly manage high-cardinality metrics.
Kubernetes and container observability
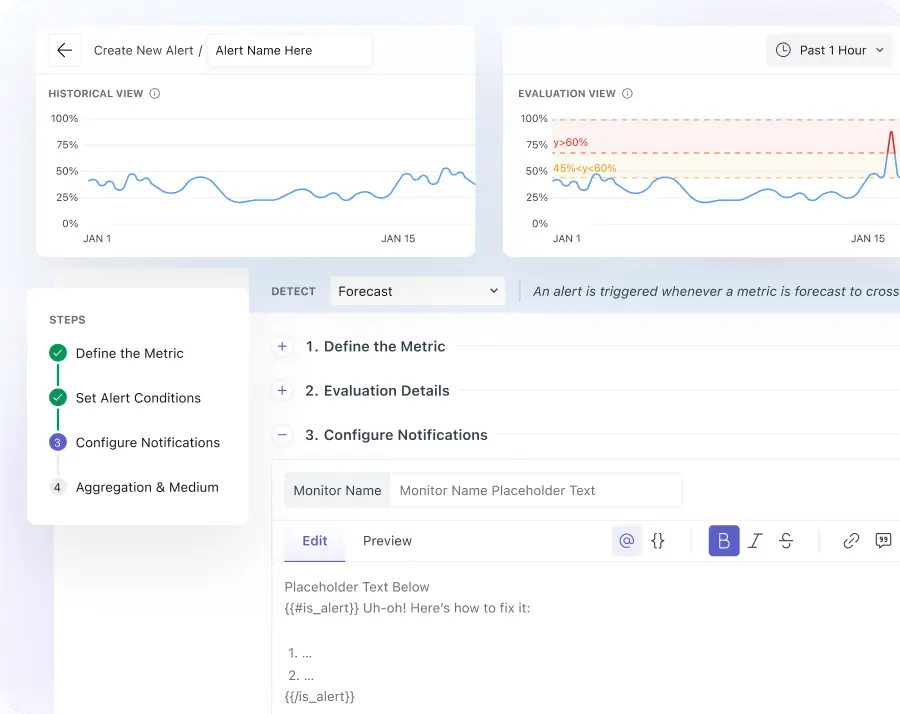
- View your metrics' forecast and predict them before any issues arise that could impact the business.
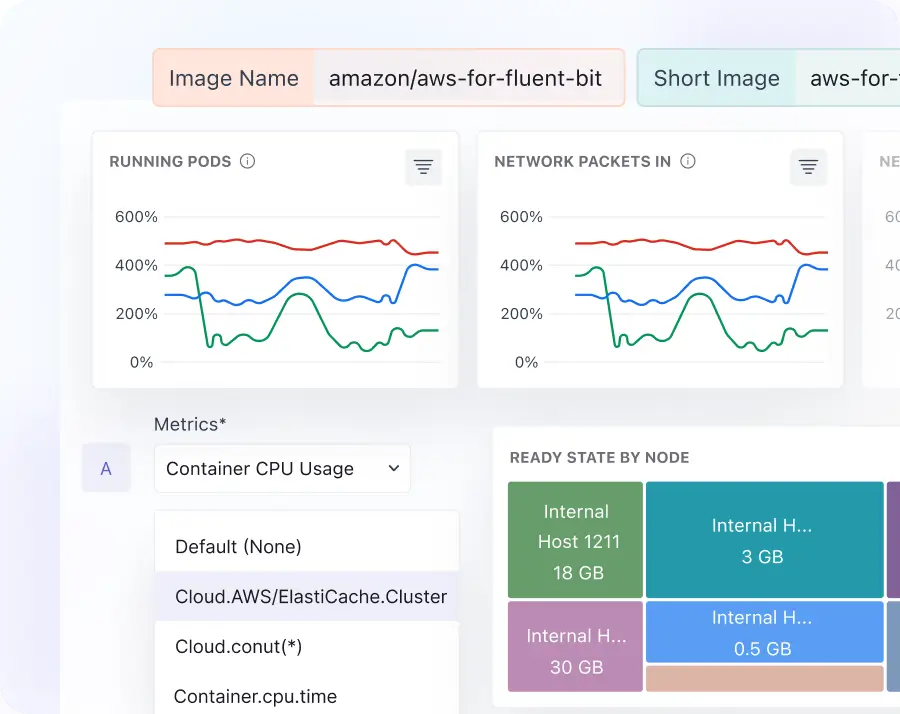
- Monitor clusters, nodes, pods, and namespaces with real-time metrics, track HPA events, OOMKills, and pod evictions before they cascade.
- Auto-discover services and workloads as Kubernetes orchestrates them, no manual tagging, no inventory drift, coverage that keeps pace with deployments.
- Analyze per-container resource utilization, throttling frequency, and request-vs-actual ratios to right-size workloads and reduce over-provisioning waste.
Infrastructure risk prevention with AI anomaly detection
- AI-assisted anomaly detection builds dynamic baselines per metric, catching degradation before static thresholds breach and before incidents reach users.
- The forecast of resource utilization trends helps identify hosts at risk of saturation ahead of traffic spikes, empowering your team to prevent incidents proactively and build confidence in your infrastructure's resilience.
- Surface which infrastructure components are leading host machines toward failure, giving SRE teams root cause context to prevent user impact before issues occur.
AI dashboard
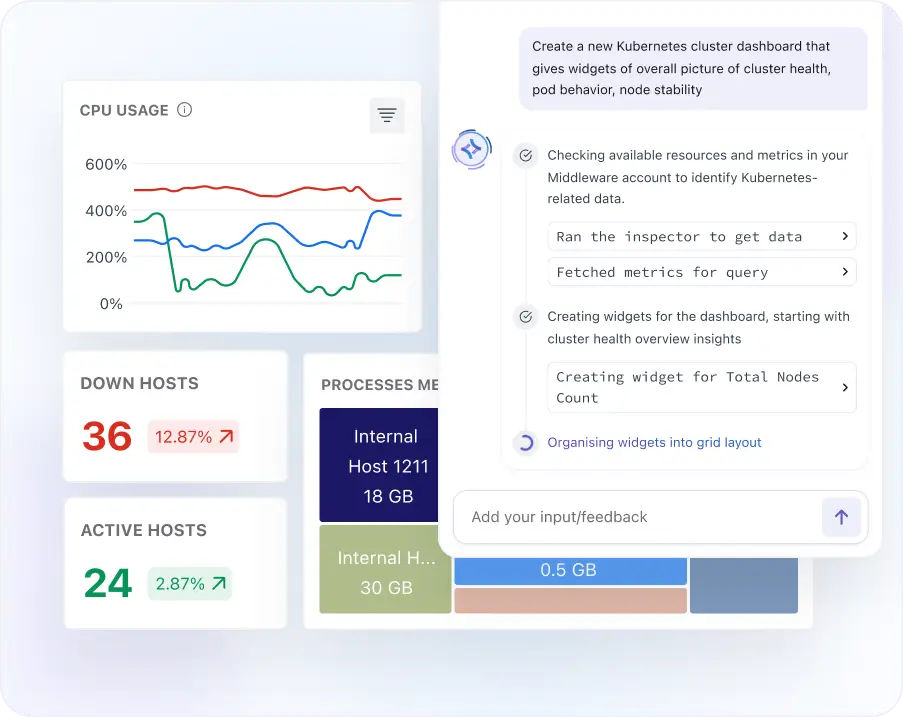
- Auto-generated dashboards for hosts, Kubernetes, ECS, Docker, and cloud services are ready on first deployment, providing instant insights and equipping your team from the start.
- Use prompt-driven, text-to-dashboard creation to build custom metric views in seconds, no PromQL expertise, no manual panel configuration required.
- Deploy a single-agent script; Middleware auto-instruments your environment, enabling rapid deployment and instilling confidence in your team from the start.
Alerts that matter
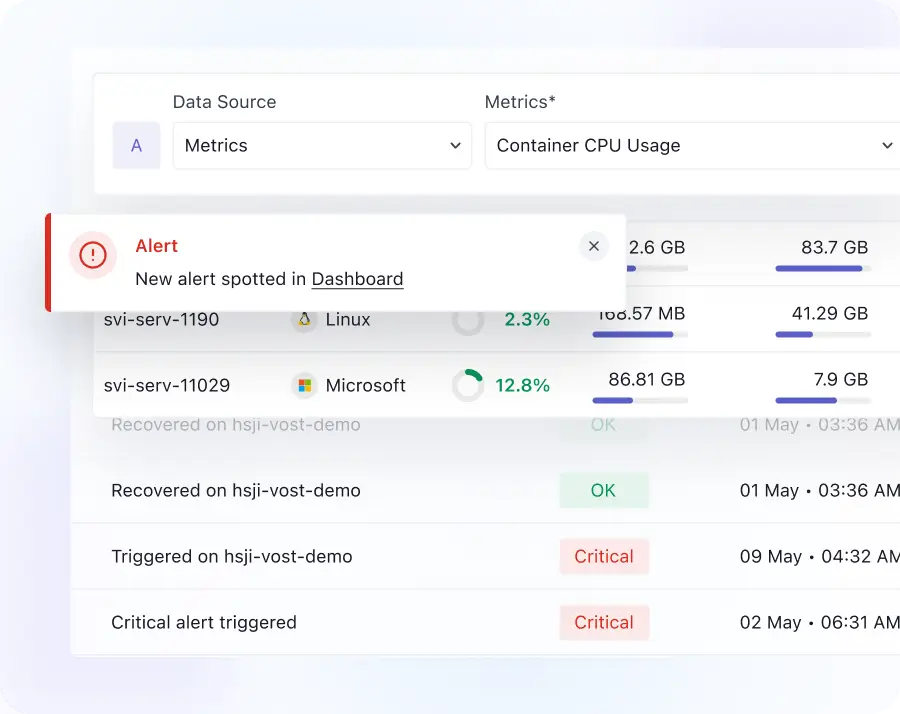
- Create alerts on any performance metrics for your infrastructure to give complete visibility into system health, enabling teams to track and respond to changes across hosts, containers, VMs, and cloud services.
- Get real-time, high-accuracy alerting to ensure issues are detected instantly, helping reduce mean time to detect (MTTD) and enabling faster incident response.
- Customize alert thresholds intelligently to reduce noise, ensuring your team focuses only on high-impact incidents and avoids alert fatigue.