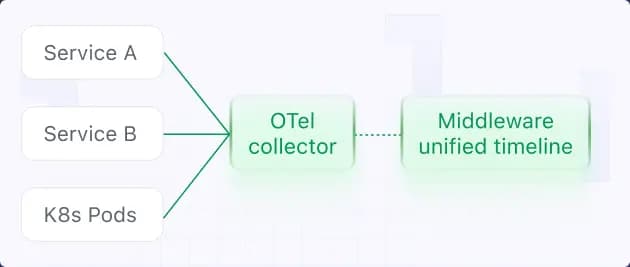
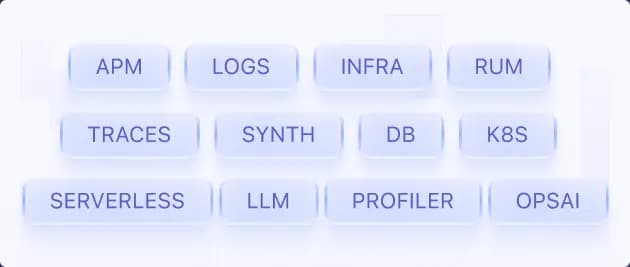
Feature Parity (99%)
APM, infrastructure, logs, distributed tracing, RUM, synthetic, database, container, serverless, and LLM observability — all bundled. If you can do it in Datadog, you can do it here.
- No separate SKUs for APM or RUM
- No "Pro" upgrade for OTel metrics
- Session replay and error tracking included
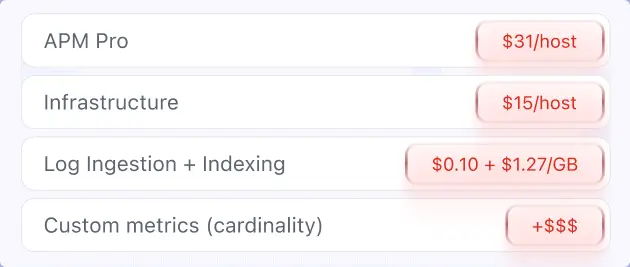
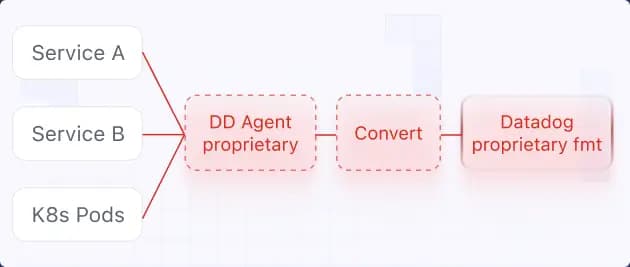
APM is one SKU. Infrastructure is another. RUM, session replay, error tracking, and custom metrics are each priced separately. You build the bundle; Datadog bills it line by line.
- Per-product pricing tiers
- Custom metrics billed by cardinality
- OTel metrics treated as premium metrics