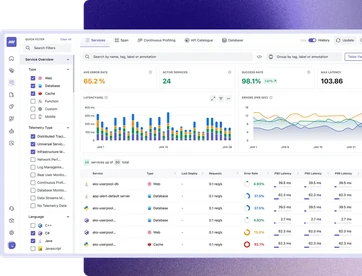
End-to-end distributed tracing to pinpoint issues easily
- Auto-instrument Kubernetes, infrastructure, applications, and databases with a single script for faster onboarding.
- Provide a complete visibility by automatically discovering applications and databases on Linux and containers.
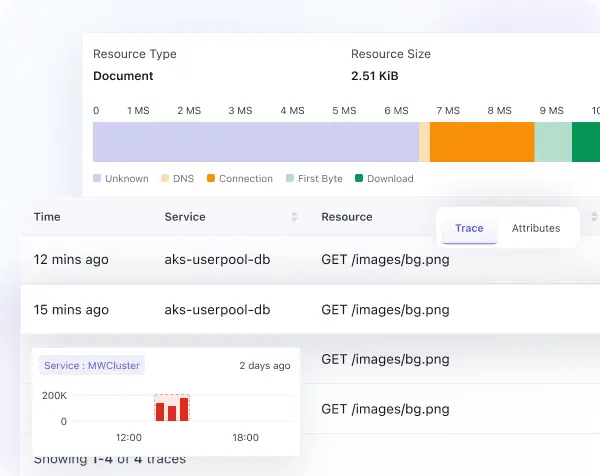
- Visualize service dependencies and trace requests end-to-end with waterfall & flamegraph views to pinpoint root causes faster.
- Correlate traces, logs, and metrics in a single view, jump from a slow span to the exact log line without switching context.
- Track Latency, Error rate, Traffic, and Saturation (LETS) in real time with trace-based alerts to catch anomalies before they affect users.
Improve app performance with end-to-end service map & telemetry correlation
- Continuously profile resources and analyze code and database queries in real time to detect bottlenecks, prevent slowdowns, and optimize responsiveness before users are impacted.
- Track dependencies, monitor end-to-end request flows, and understand communication patterns across your stack to quickly isolate the exact service causing a performance degradation.
- Visualize frontend-to-backend-to-database dependencies through interactive service maps for an intuitive, real-time view of your application architecture.
- Correlate traces and logs via TraceID for precise, request-level context, enabling engineers to jump from a performance anomaly to its root cause without switching tools.
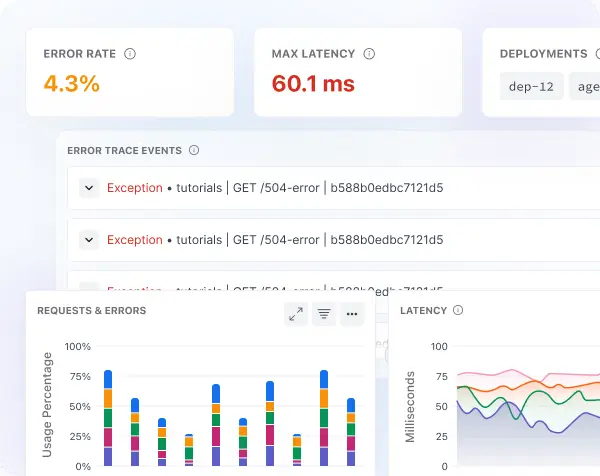
Automated root cause analysis (RCA) helps you reduce MTTR
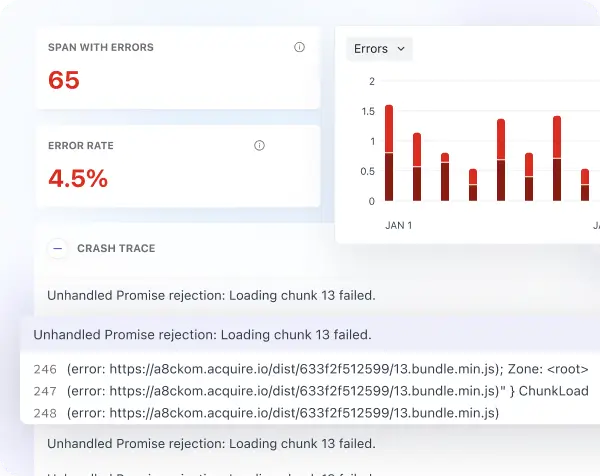
- OpsAI detects and resolves all application errors automatically, including full stack traces, error types, and code-level context
- Automated root case analysis pinpoints the exact code, query or configuration causing issues, significantly reducing MTTR and MTTD.
- Instantly isolate error-prone services and surface connected dependencies to understand the blast radius and resolve issues efficiently across your stack.
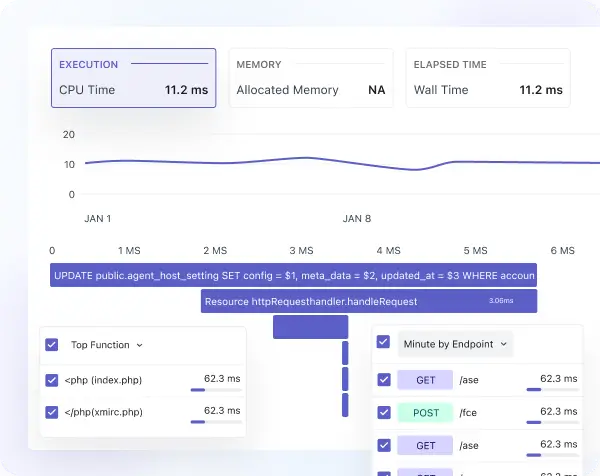
Performance profiling & application monitoring
- Continuously profile application resources in real time to detect bottlenecks as they occur.
- Analyze slow database queries and code-level performance to prevent service degradation.
- Use distributed tracing to monitor service dependencies and optimize end-to-end request flows.
- View all APIs with request rate, latency, and error metrics — integrated with OpenAPI (Swagger) documentation.
- Track internal and external API endpoints with query-level visibility for unified observability.
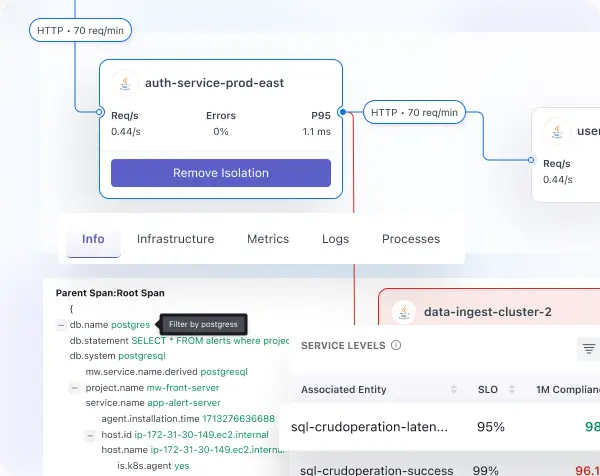
Service observability & dependency mapping
- Track real-time service metrics including latency, throughput, request rate, and error rate.
- Monitor downstream dependencies to detect performance issues before they cascade.
- Visualize service communication and architecture with interactive, multi-view service maps.
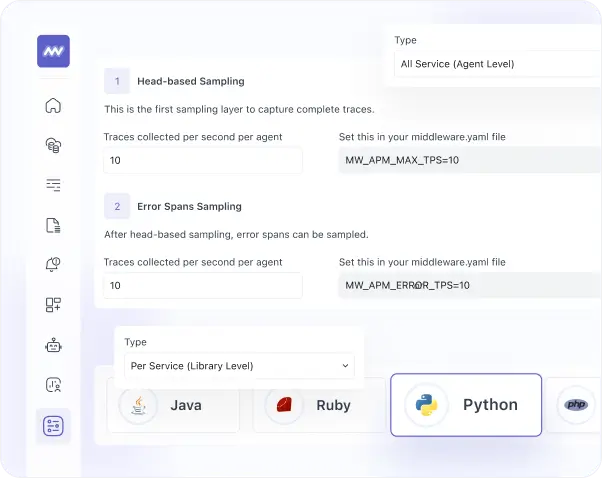
Data ingestion control & open standards
- Auto-generated dashboards for hosts, Kubernetes, ECS, Docker, and cloud services are ready on first deployment, providing instant insights and equipping your team from the start.
- Use prompt-driven, text-to-dashboard creation to build custom metric views in seconds, no PromQL expertise, no manual panel configuration required.
- Deploy a single-agent script; Middleware auto-instruments your environment, enabling rapid deployment and instilling confidence in your team from the start.