Log
Monitoring

Eliminate blind spots with unified log monitoring. Make troubleshooting faster with AI-driven insight and total data control at a 90% savings.

No credit card required

Trusted By Leading Companies

Middleware Logo
Log Monitoring Tool

Product overview

Middleware Log Monitoring unifies logs from every layer of your stack with AI-powered management and deep context. With complete visibility and the ability to correlate logs with traces and metrics in a single pane of glass, you can pinpoint root causes instantly, slash MTTR, and optimize overall performance. Achieve enterprise-grade observability and 100% data control at a fraction of the price of legacy solutions.

  • Faster troubleshootingFaster troubleshooting

  • Filter & PipelineFilter & Pipeline

  • ScalingScaling

  • Historical LogsHistorical Logs

  • Log NotebookLog Notebook

Comprehensive Monitoring

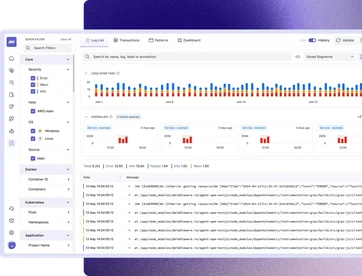
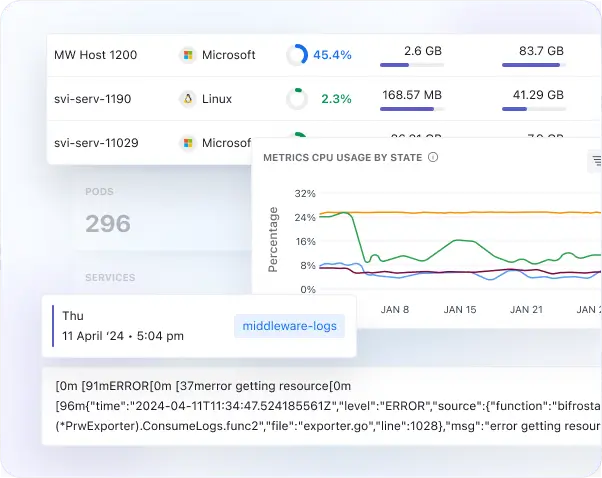
Faster troubleshooting with comprehensive log monitoring

  • Collect logs from across your stack, including applications, cloud services, and on-premises infrastructure.
  • Correlate logs with corresponding APM traces, metrics with a single click for full context.
  • View all log attributes, related logs, and log properties with one click.
  • Navigate instantly between dashboards, traces, metrics, and associated logs to speed up troubleshooting.
Log Patterns

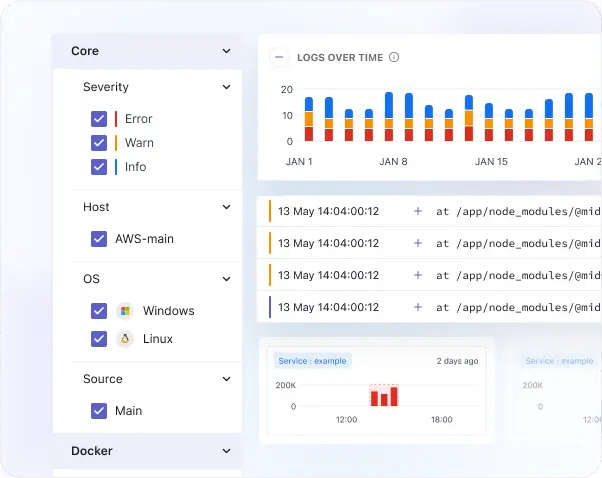
Log searching, filtering and pipeline 

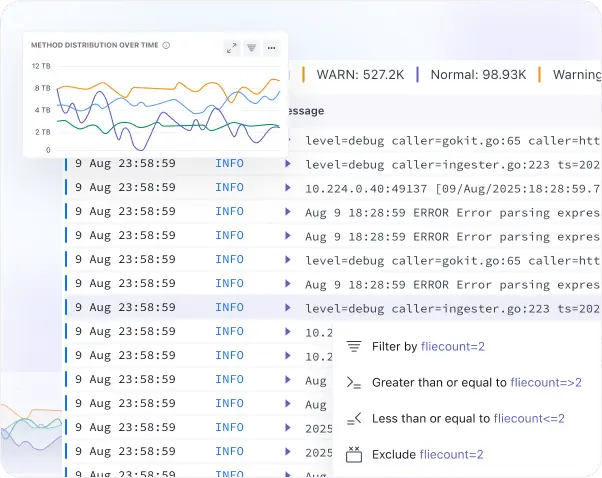
  • Find similar logs with log pattern detection.
  • Explore structured pattern insights with detailed value distribution and attribute breakdown.
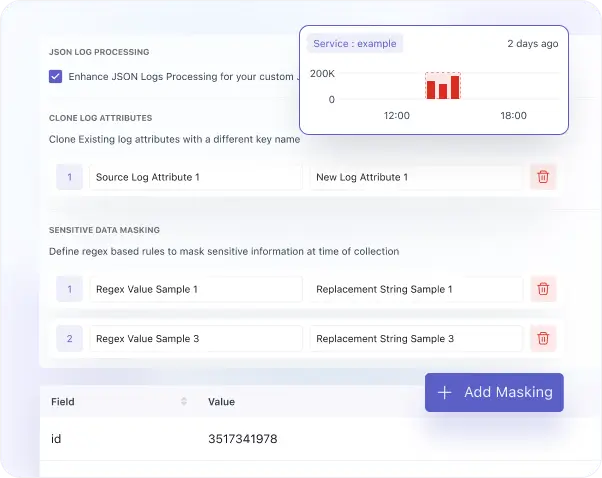
  • Reduce log volume and costs by configuring processor rules, filtering logs by attributes, and dropping them per configuration at the ingestion level.
  • Use regex parsing to add custom attributes or drop unwanted logs.
  • Easily build, monitor, and manage log pipelines in the settings panel. 
Log Pipeline

Logging at scale

  • Scale without worrying about cost and performance.
  • Send and process millions of logs per minute or petabytes per month seamlessly. 
  • Longer log retention without any additional cost.
  • Rapid troubleshooting and log analytics with no querying language.
  • Analyze parsed attributes, related logs, and raw logs together in a unified log detail view.
  • Ensure support for PCI compliance and HIPPA standards.
Logging at scale

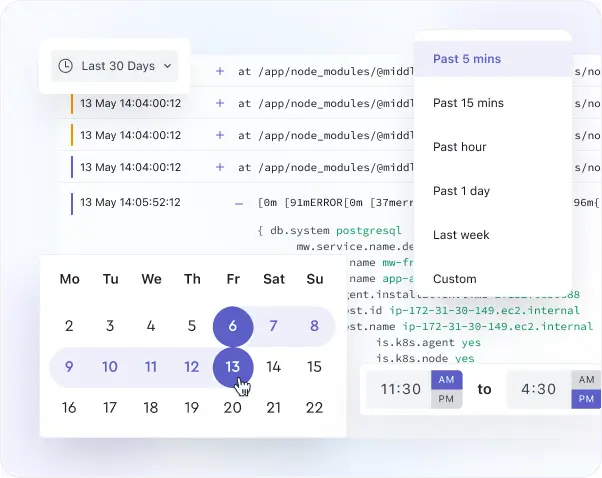
Retrieve historical logs

  • View historical log data with the time travel feature to easily navigate across different time ranges and investigate past system behavior in detail.
  • Analyze log data from up to 6 months ago to gain deeper visibility into long-term performance, anomalies, and system changes over time.
  • Use time travel to identify trends and patterns in log data.
  • Revisit historical logs with structured views to uncover trends and recurring patterns.
Notebooks for Logs

Notebooks for Logs

  • Create interactive notebooks combining charts, tables, graphs, and contextual notes for investigations.
  • Document findings with structured visualizations to make log analysis collaborative and actionable. 
  • Share notebooks across teams to promote collaboration, streamline troubleshooting, and foster a sense of shared achievement in incident resolution.

Start Log Monitoring Free and Debug Faster Today

Hear it from the best: Why top companies trust Middleware

Middleware has played a very good role in transforming our observability and application performance. For instance, we reduced our total observability costs by 50%.

Take an Interactive Tour for Log Monitoring

Check out this step-by-step, interactive demo of Middleware's Log Monitoring.

Ingest and Monitor
Logs in Minutes

Collect logs from applications, servers, and cloud services with minimal setup, no complex configuration required. Get real-time visibility into logs to search, analyze, and troubleshoot issues faster.

Kubernetes

View Docs

Docker

View Docs

Windows

View Docs

450+

Agents & Integrations

View Docs

Need Help with Log Data or Queries?

Contact us

FAQs

Everything you want to know about the Log Monitoring

What is log monitoring?

Log Monitoring helps you collect, analyze, and correlate log data from across your tech stack to identify trends, patterns, and issues, and improve performance.

From which sources can I collect logs?

Middleware supports logs from infrastructure, applications, cloud services, and on-premises systems, ensuring comprehensive coverage for your entire tech stack.

Why Middleware for log monitoring?

Easy to set up, with no additional configuration required for log monitoring. AI search and reusable filters help to identify issues faster and reduce MTTR. It allows you to create alerts on it for faster troubleshooting.

How can I get started with Middleware logs?

Setting up logs with Middleware is straightforward and stress-free. It doesn’t require any additional configuration; you can quickly configure the Infrastructure agent for infrastructure-level logs and APM for application logs. Once the agent is configured, it will start collecting logs, allowing you to feel assured that your system is under control and ready for troubleshooting.

How long can I store logs with Middleware?

The default retention period for logs is 30 days (which can be extended on request).

Optimize More, Worry Less With Middleware