



Server health monitoring tracks CPU, memory, disk, and network usage in real time, helping you find problems before they cause downtime. Many outages happen because warning signs go unnoticed. If a server becomes overloaded, it can slow down or disrupt your applications and affect your users. In this guide, you’ll learn which server health metrics to monitor, how server health monitoring works, and how Middleware helps you detect issues early with real-time alerts.
Key takeaways
- Server health monitoring continuously tracks CPU, memory, disk, and network activity to catch problems before they cause downtime.
- Monitoring runs in six stages: data collection, transmission, analysis, visualization, alerting, and response.
- Core components to track span system resources, application performance, infrastructure dependencies, network performance, and security and access indicators.
- Middleware collects these metrics with lightweight agents at a default 10-second interval across on-premise, cloud, or hybrid environments.
- Built-in and custom alert thresholds, combined with intelligent alert management, cut down on false positives and alert fatigue.
- OpsAI can automatically resolve common, repeatable server issues, shortening the time between alert and fix.
What is server health monitoring?
Server health monitoring is the practice of continuously tracking a server’s performance, availability, and resource usage to find issues before they cause outages.
You can think of server health monitoring as a health check for your infrastructure. By detecting issues early, it reduces downtime and improves key reliability metrics such as MTTR and MTTD.
A few crucial indicators that are usually measured are:
- CPU usage: the amount of processing power being utilized
- Memory usage: how much RAM is in use and how efficiently
- Disk usage: free storage and I/O performance
- Network activity: traffic, throughput, and latency
- Service responsiveness: if critical applications or services are responsive and performing well
Ignoring these signals doesn’t just slow things down, it often leads to unscheduled reboots, lost productivity, revenue impact, and even security vulnerabilities when systems aren’t patched or resources are maxed out.
To prevent these failures, let’s explore how server health monitoring works in practice and the different approaches teams use to keep systems running smoothly.
What counts as a healthy server in 2026?
A simple ping or uptime check was enough in the past, but that’s no longer the case. Today, a single application may run across physical servers, cloud virtual machines (VMs), Kubernetes clusters, and serverless environments. That means a healthy server is about more than just being online. It should have stable CPU, memory, storage, and network performance, show no signs of resource exhaustion, and meet your organization’s security and compliance requirements.
How server health monitoring works: Step by step
Server health monitoring collects and analyzes real-time data from your servers using either agent-based or agentless monitoring. It tracks key performance metrics, detects potential issues, and displays them in dashboards for easy monitoring. When problems are detected, the system sends alerts so your team can respond quickly. Here’s how the monitoring process works step by step:
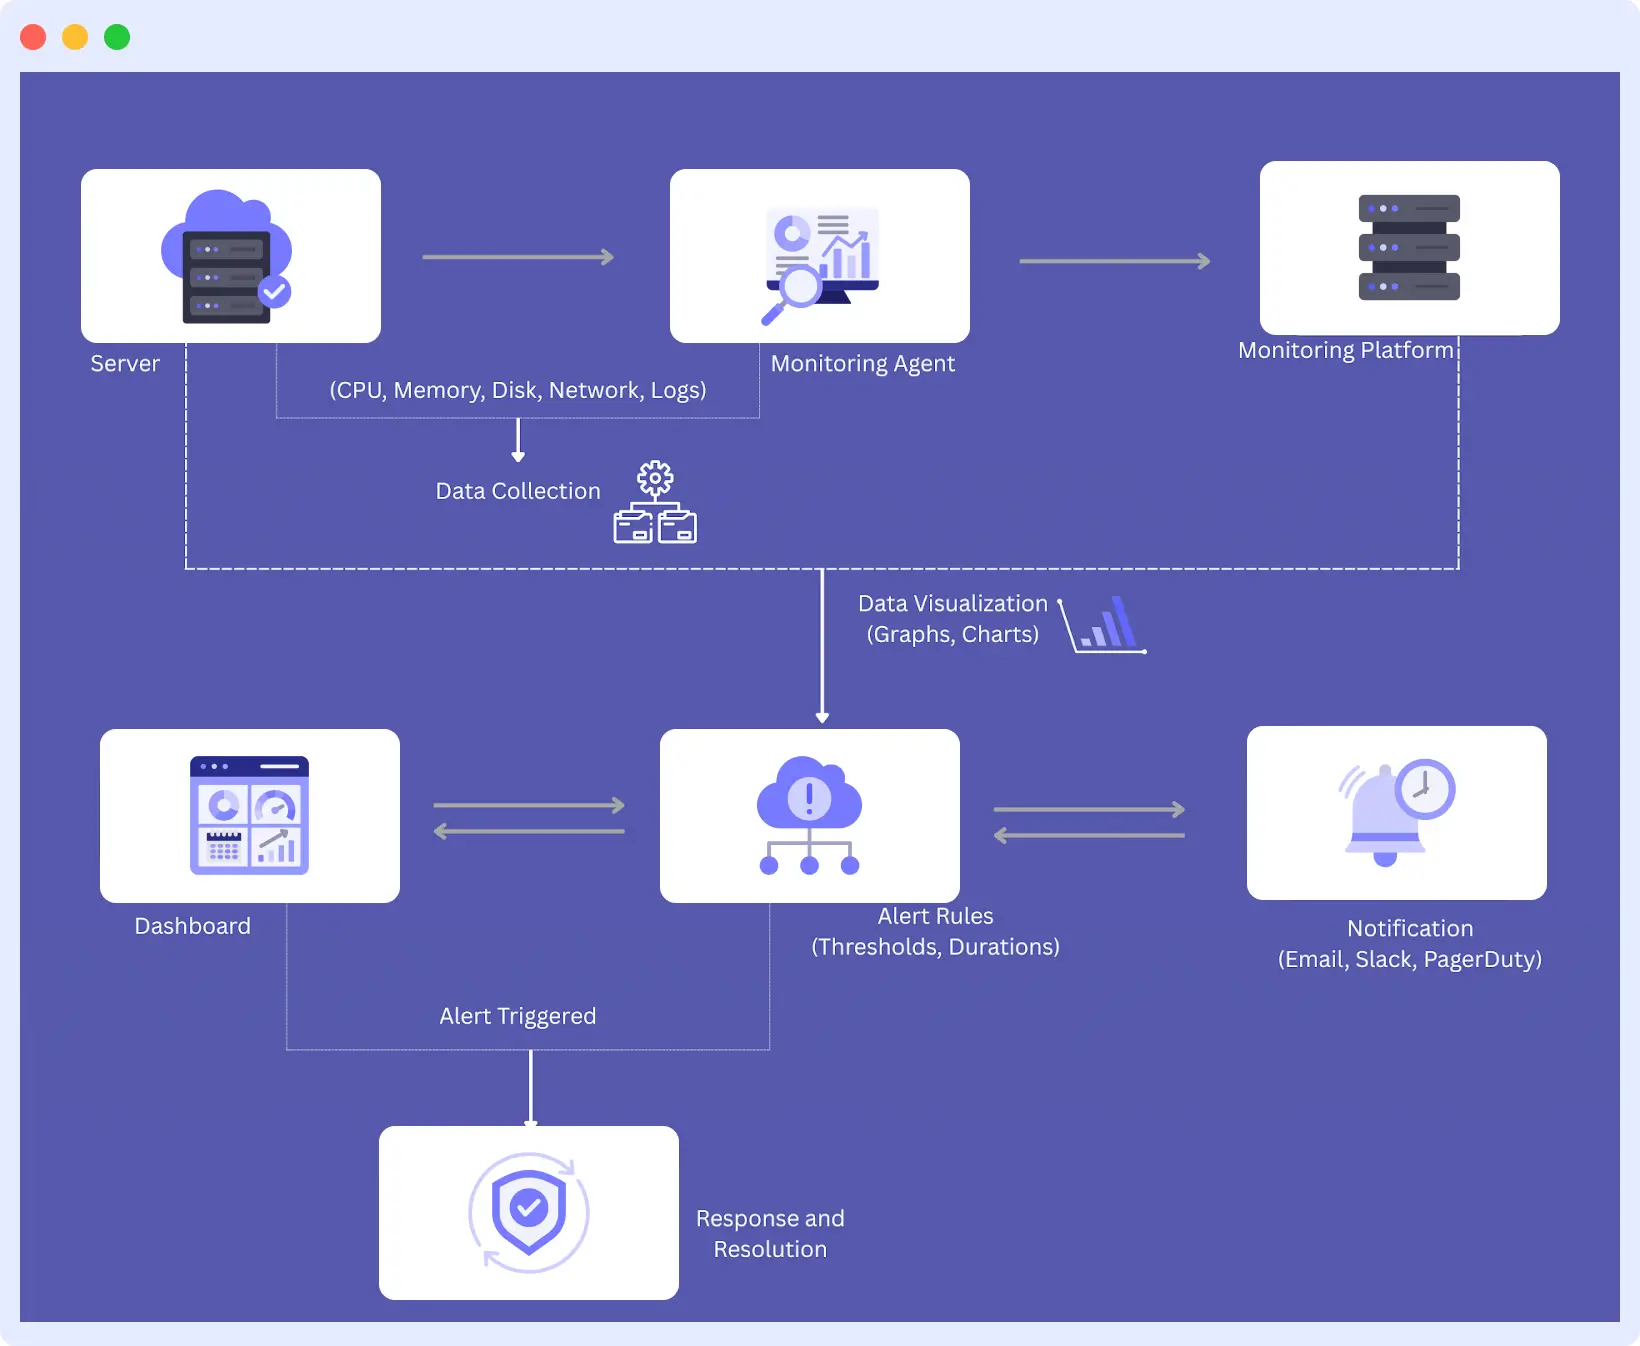
This is the breakdown of each stage:
1. Data Collection
Server monitoring starts by collecting data such as CPU usage, memory usage, disk I/O, network activity, and the status of services and applications. Monitoring agents, scripts, or built-in operating system tools collect this data continuously.
Middleware supports both agent-based and agentless monitoring, making it easier to collect metrics across on-premises, cloud, and hybrid environments with minimal manual setup.
2. Data Transmission
The collected data is sent to a central monitoring platform, either in the cloud or within your own infrastructure. Secure protocols help ensure the data is transferred safely and reliably, even during periods of high traffic.
Example: During peak traffic, Middleware ensures you can still track metrics instantly without delays.
3. Data Analysis
The monitoring system analyzes the data to identify unusual activity and performance issues. It compares current values with preset thresholds, looks for sudden spikes, and tracks changes over time.
For example, a steady increase in CPU usage may point to inefficient code, rising traffic, or another performance issue that needs attention.
4. Data Visualization
The analyzed data is displayed in dashboards, graphs, and heatmaps. These visuals help teams understand server health, spot unusual behavior, and investigate specific metrics more quickly.
Pro Tip: Dynamic dashboards help you drill down from high-level server health to specific containers or services in seconds.
5. Warning/Alert
When the system detects a problem, such as a failed service, high CPU usage, or low available memory, it sends an alert.
Alerts can be delivered through email, Slack, SMS, and other channels. They can also be prioritized by severity, helping teams focus on important issues and avoid alert fatigue.
6. Response
System administrators or DevOps engineers review the alert, investigate the issue, and take action. This may involve restarting a service, scaling infrastructure, updating a configuration, or checking logs to find the root cause.
A fast response helps reduce downtime and keeps systems running smoothly. For common and repeatable issues, OpsAI can automate parts of the response, reducing the time between detection and resolution.
Best practice: Automate routine responses, like auto-scaling or restarting failed services, using automated incident response to prevent repeat downtime.
Core components to track in server health monitoring
A server’s health isn’t just about whether it’s running. Effective server health monitoring tracks different parts of your infrastructure to keep systems performing well and identify potential issues early.
Here’s what each monitoring category helps you understand.
| Component category | What it tells you |
|---|---|
| System resources | Whether the server itself has the CPU, memory, and disk headroom to keep running |
| Application performance | How the app behaves from a user’s and backend’s perspective, response time and errors included |
| Infrastructure dependencies | Whether the databases, APIs, queues, and load balancers your server relies on are healthy |
| Network performance | How fast and reliably the server communicates with other systems and users |
| Security and access | Whether login attempts, access patterns, and certificates point to a risk |
1. System resource metrics
These indicators tell you how the underlying hardware and operating system are functioning.
- CPU usage: Monitor overall CPU usage and scaling across cores to detect processing bottlenecks. Sustained heavy usage above 80% can signal a need for optimization or scaling.
- Memory use (RAM): Monitor free and utilized memory along with swap usage. Application slowdowns and crashes often trace back to low RAM or memory leaks.
- Disk space: Monitor space across all mount points. Disk space exhaustion halts activity entirely, and tracking growth trends supports capacity planning.
- Disk I/O performance: Measure read and write speed, queue depth, and input/output operations per second (IOPS).
2. Application performance indicators
These show how your app performs from the user and backend perspectives.
- Response times: Track how fast your application responds to a request. Response time is a critical part of the user experience, so it’s an early sign of a problem.
- Throughput: Use requests per second or transactions per minute to measure the app’s capacity and spot traffic surges.
- Error rates: Monitor HTTP error codes (4xx, 5xx), app exceptions, and failing transactions.
- Request queues: Monitor pending requests and queue lengths to identify when your app is getting overwhelmed.
3. Infrastructure dependencies
Infrastructure dependencies are the external systems, services, or resources your server communicates with to perform well. While independent of the server itself, they’re critical for performance and reliability.
- Database connections: Track active connections between the database and application via database monitoring, including connection pool usage, query execution speed, and accessibility. Database issues can cause the application to crash or hang.
- Availability of external APIs: Use synthetic monitoring to track third-party API responsiveness and health indicators like response time and error rate. Downtime or lag here can disable essential functionality.
- Message queues: Message queues process asynchronous communications by buffering and routing messages between services. Track queue depth, processing rate, and consumer health to avoid bottlenecks.
- Load balancers: Load balancers split incoming traffic among several servers to avoid overload. Track traffic splitting, health checks, and failover behavior to maintain smooth routing.
4. Network performance
Network metrics measure how fast and reliably your application communicates with other systems, users, and services. Even the fastest server can seem sluggish or offline when network connectivity is weak.
- Bandwidth usage: Data being transferred and received on the network. Unusually heavy use may represent a traffic flood or a loss of data.
- Packet loss: Occurs when packets fail to reach their destination, due to congestion or failing hardware. A common indicator of unreliable connections.
- Latency: The time a data packet takes to move between source and destination, usually measured in milliseconds. Poor latency impacts app responsiveness and real-time capability.
- DNS resolution time: The duration domain names take to resolve to IP addresses.
- Connection errors: Errors in establishing or maintaining a connection, such as timeouts and resets. Recurring issues can indicate unreliable network routes or congested services.
5. Security and access indicators
Beyond performance metrics, access monitoring and security help trace activity and patterns that may indicate threats, unauthorized access, or compliance issues affecting your system and data security.
- Authentication failures: Failed logins that may indicate genuine user mistakes or a brute-force attack.
- Access violations: Access attempts by invalid users or systems to files or functions they aren’t allowed to reach. Monitor for attempts against valuable resources or administrator accounts.
- Certificate expiration: Tracks the validity of SSL/TLS certificates protecting network traffic, helping you avoid invalid or misconfigured certificates.
- Unusual traffic patterns: Abnormalities in regular network traffic, such as spikes from uncommon locations or abnormal request patterns, can signal a security attack.
6. Hardware-specific metrics
On bare-metal and on-premise servers, software metrics alone miss physical failures building up underneath the OS. Track these alongside the categories above:
- Temperature and fan speed: Overheating throttles CPUs and shortens hardware lifespan. Rising temperature with steady fan speed usually points to a failing fan or blocked airflow.
- Power supply status: Redundant power supplies can fail silently until the second one goes. Monitor PSU status directly rather than assuming redundancy means safety.
- SMART disk status: Self-Monitoring, Analysis, and Reporting Technology (SMART) attributes flag failing drives before they cause data loss, often days or weeks in advance.
- Inode usage: A filesystem can hit its inode limit and stop accepting new files even with plenty of free disk space left. This is easy to miss if you only track raw disk space.
Virtual and cloud-hosted servers don’t expose most of these directly since the hypervisor or cloud provider manages the physical layer, but CPU steal time, covered above, is the equivalent signal: it tells you when your virtual server is waiting on physical resources it doesn’t fully control.
Physical vs. virtual server monitoring
The two share most metrics, CPU, memory, disk, and network all still matter, but what you can see and who is responsible for fixing it differs.
| Aspect | Physical server monitoring | Virtual server monitoring |
|---|---|---|
| Hardware visibility | Direct access to temperature, fan speed, PSU status, and SMART data | Hidden behind the hypervisor or cloud provider, mostly inferred from steal time and performance symptoms |
| Resource contention | Resources are dedicated to that one machine | Resources are shared with other VMs on the same host, so noisy neighbors can affect performance |
| Scaling response | Requires physical intervention, adding hardware, or provisioning new servers | Can often scale automatically or be resized without physical changes |
| Who fixes hardware failures | Your team or your data center provider | The cloud or virtualization provider, though you still monitor the guest OS and applications |
Most teams run a mix of both today. Middleware monitors physical, virtual, and containerized infrastructure from the same platform, so you don’t need separate tools for each layer.
Middleware for server health monitoring
Choosing the right server health monitoring platform is just as important as knowing which metrics to track. Middleware is an OpenTelemetry-native observability platform that helps teams monitor server health, detect issues early, and troubleshoot faster from a single dashboard.
Whether you’re managing a few servers or thousands of hosts across cloud, on-premises, or hybrid environments, Middleware provides complete visibility into your infrastructure.
Unified Server Visibility
Middleware automatically discovers all your servers and displays their health in real time. Monitor CPU, memory, disk, network, and server status from a single dashboard across physical servers, virtual machines, and Kubernetes environments.
Lightweight agents collect metrics every 10 seconds by default, giving you near real-time visibility into infrastructure performance with minimal overhead.
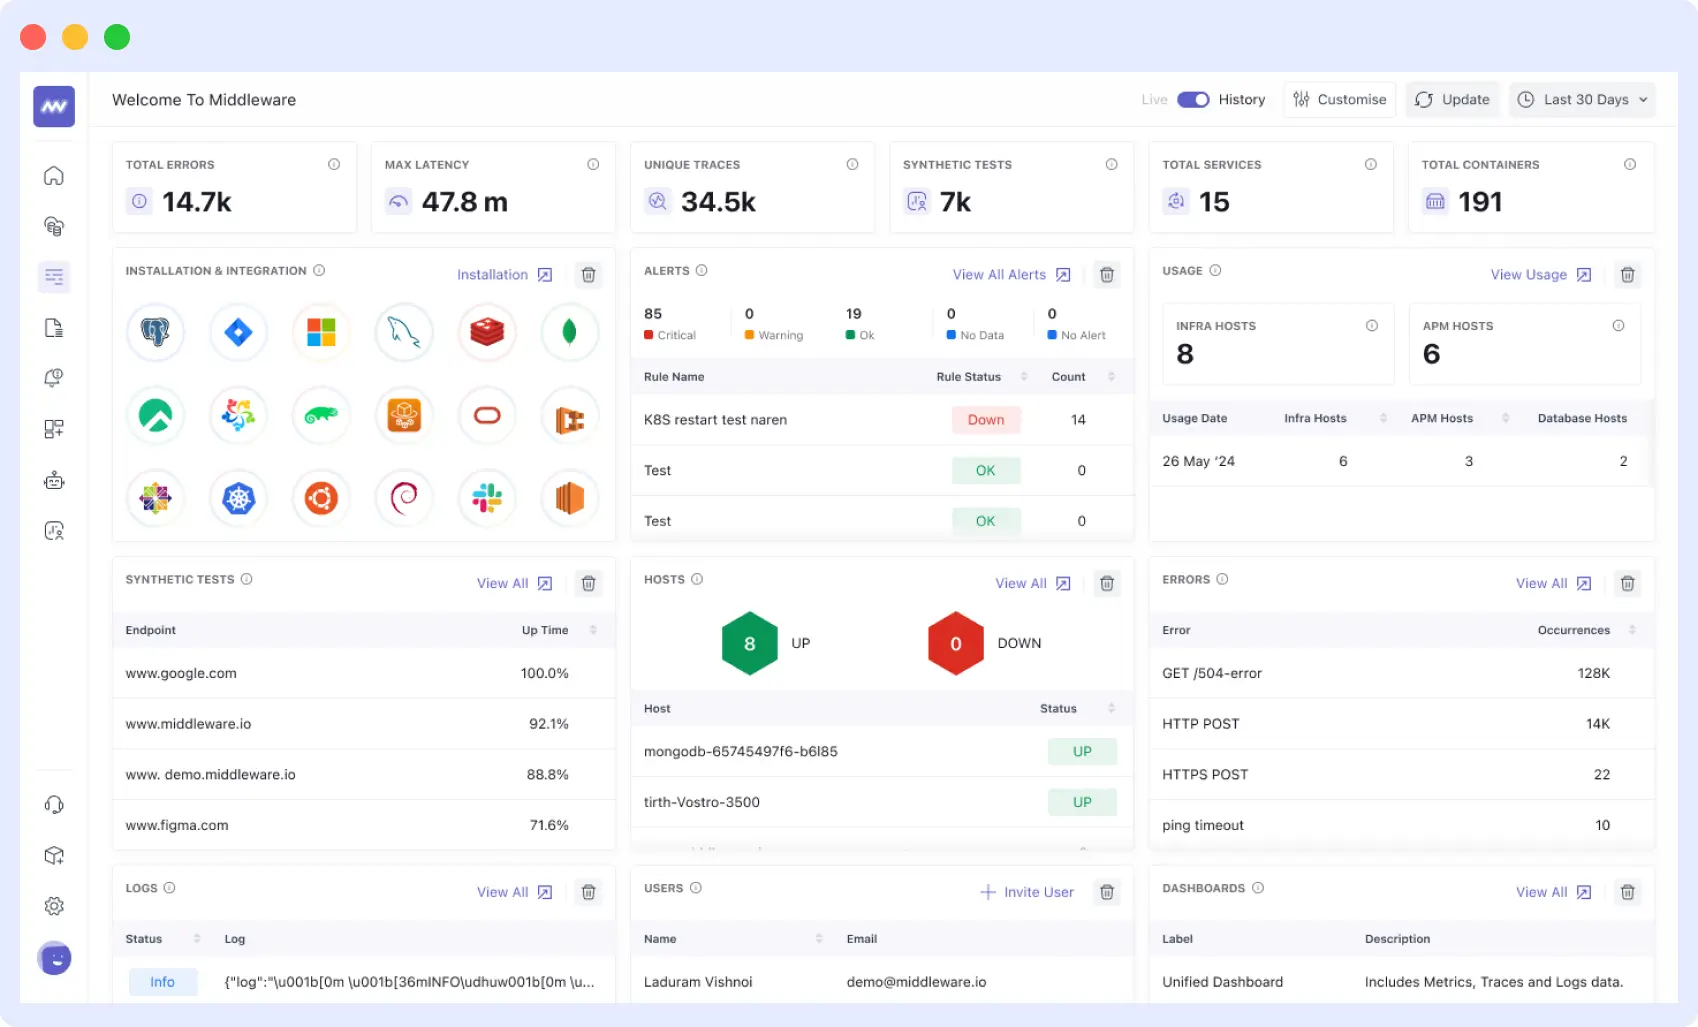
Whether you run physical servers, virtual machines or containerized infrastructure, Middleware provides immediate insights into the health and performance of each member. If you specifically want to go deeper into Windows environments, check out our guide on Windows Server Monitoring.
Monitor Critical Server Metrics
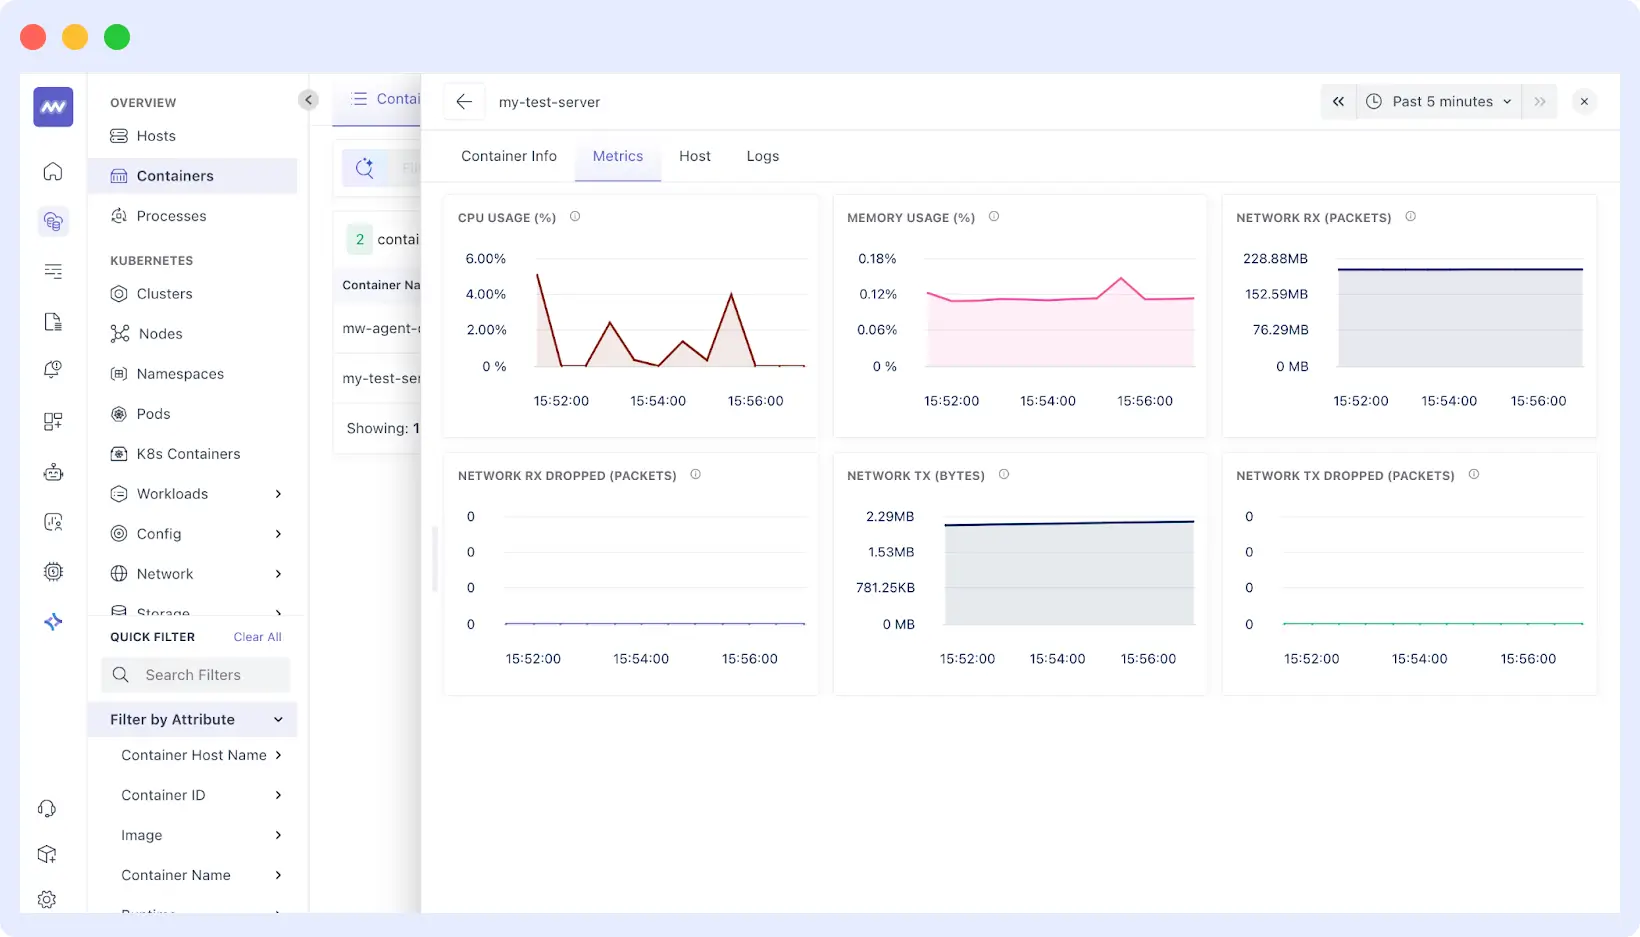
Middleware continuously tracks the metrics that matter most for server health, including:
- CPU metrics: General usage, per core usage, 1min, 5min, 15min load averages, and CPU steal time
- Memory monitoring: Used/available, swap usage, buffer/cache usage, and memory pressure measures
- Disk monitoring: Disk space available across mount objects, I/O operations per second (IOPS), read/write throughput, and disk queue depths.
- Network performance: Bytes sent/received, packet loss rates, connection states and network interface usage
Built-in and customizable alerting
Middleware helps teams detect issues quickly without creating unnecessary alert noise.
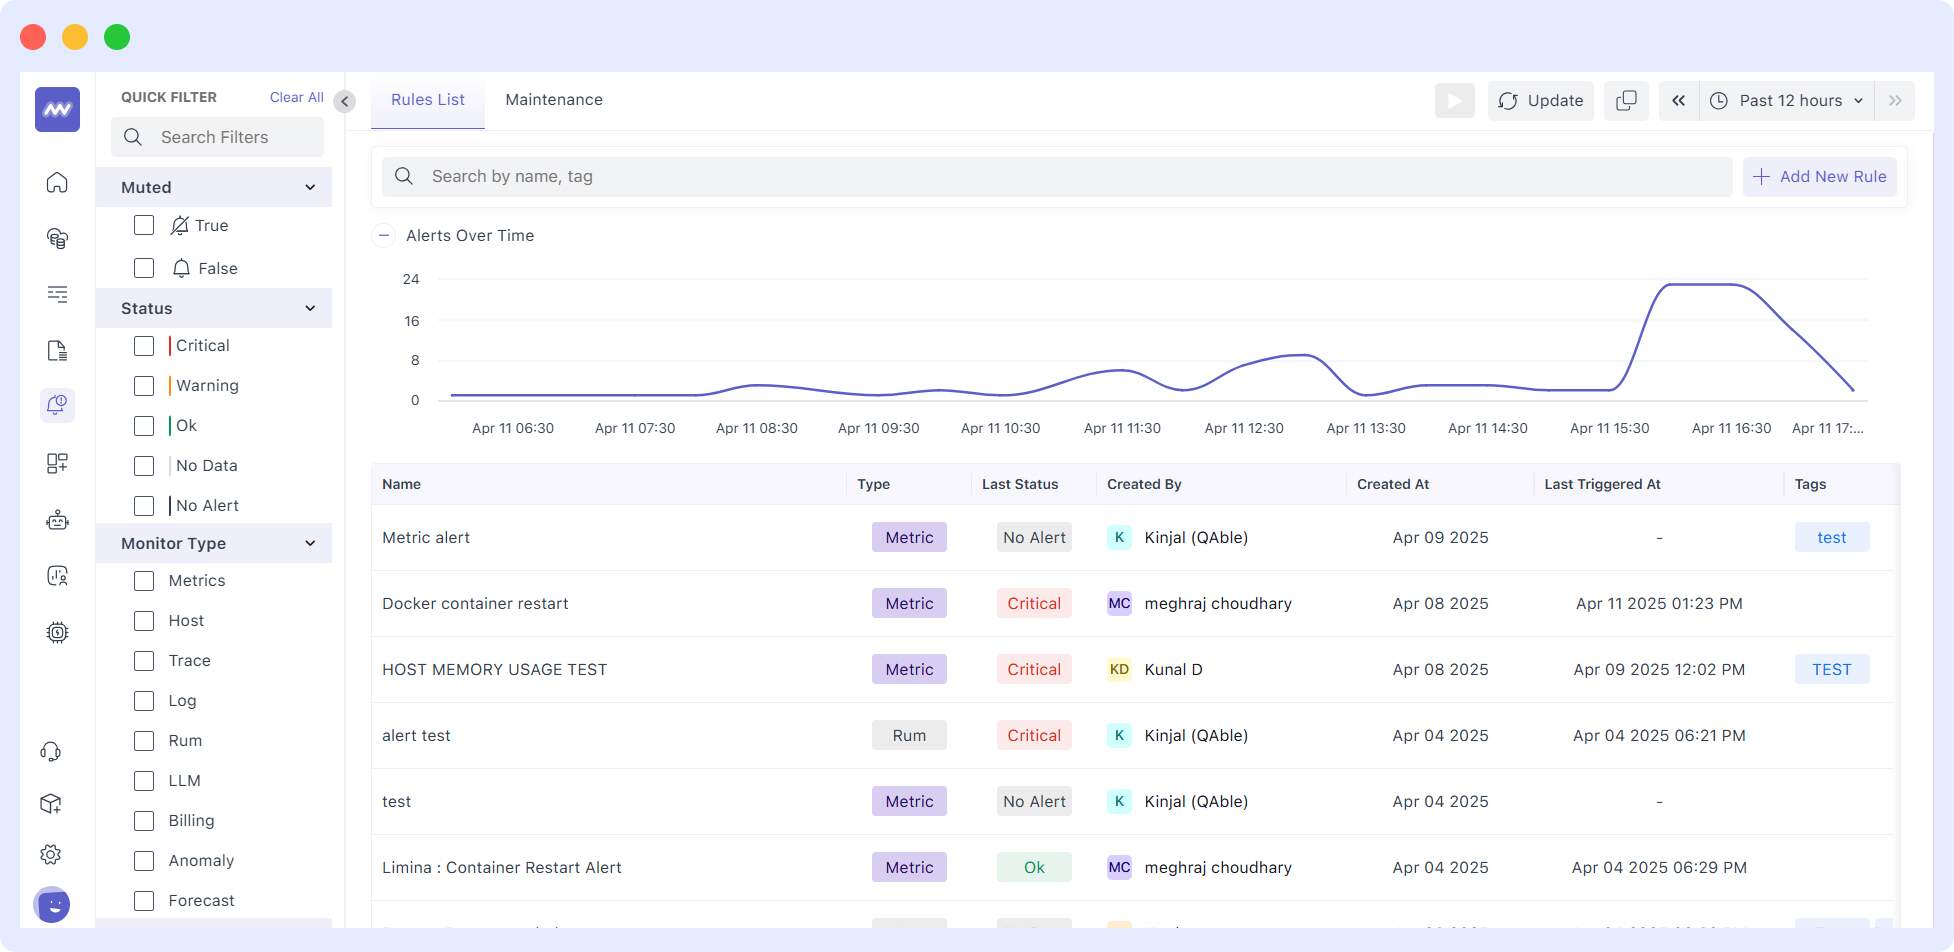
- Built-in alerts for common issues such as high CPU usage, memory exhaustion, low disk space, and service failures.
- Custom alerts that let you define thresholds, combine multiple conditions, and configure escalation policies based on your infrastructure.
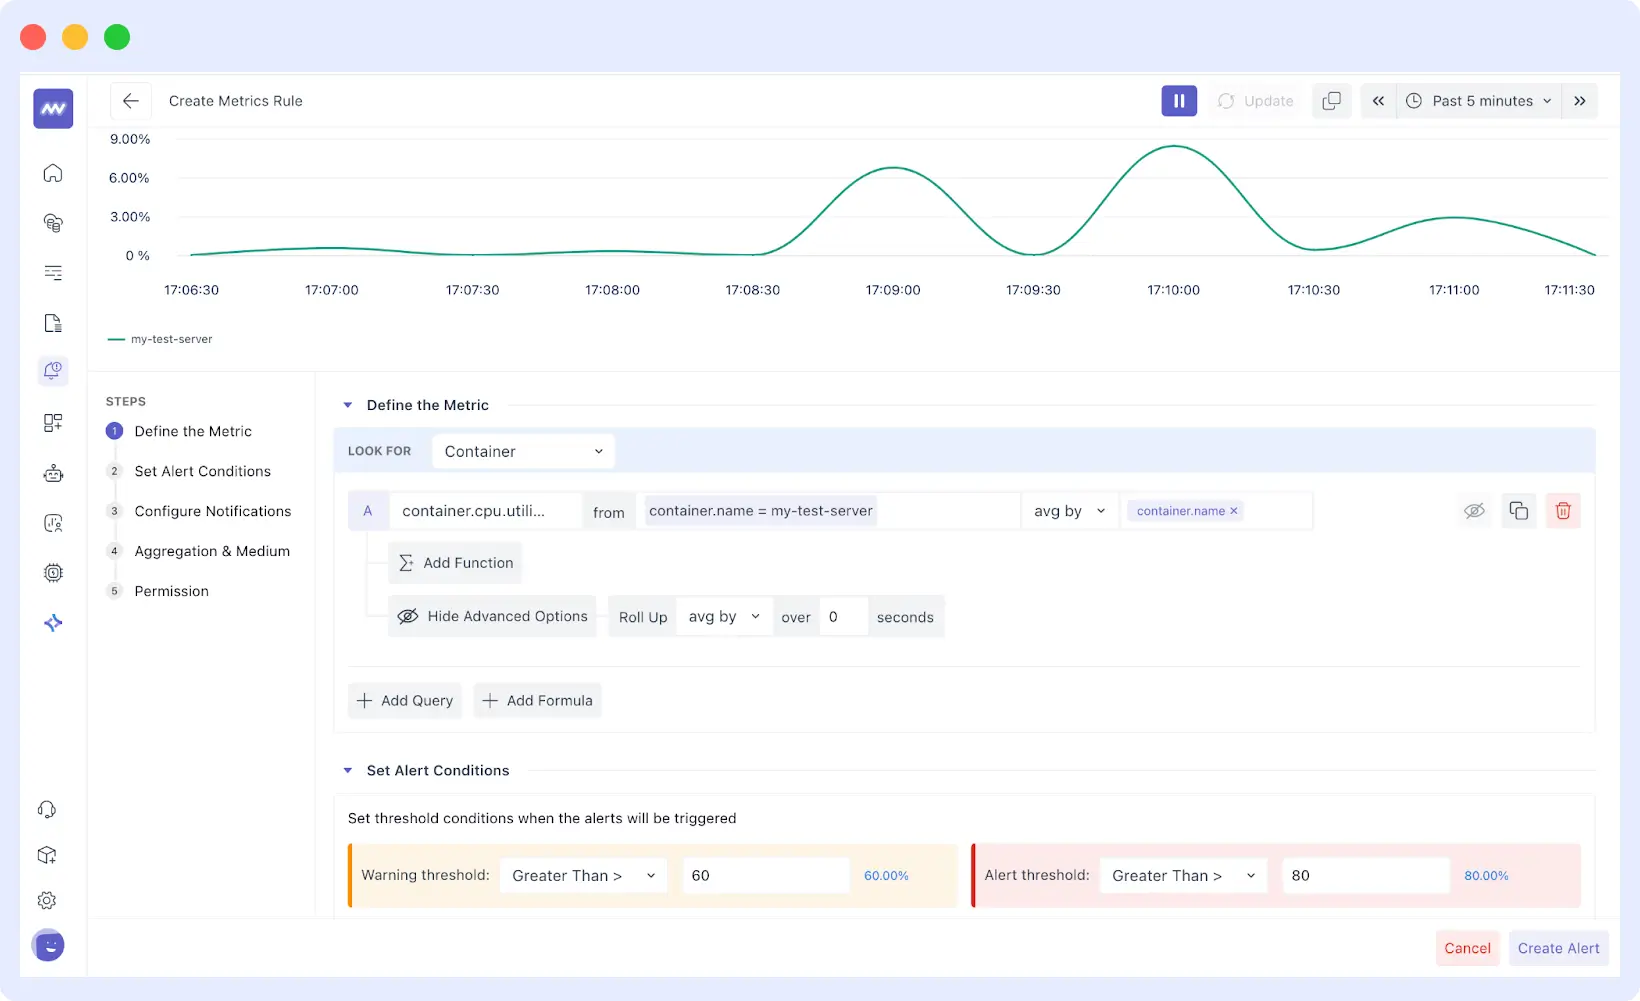
- Intelligent alert management to reduce false positives and alert fatigue through severity levels, correlation rules, and time-based conditions.
Alerts can be delivered through Slack, PagerDuty, email, and other notification channels so your team can respond immediately.
Dashboards, Logs, and Integrations
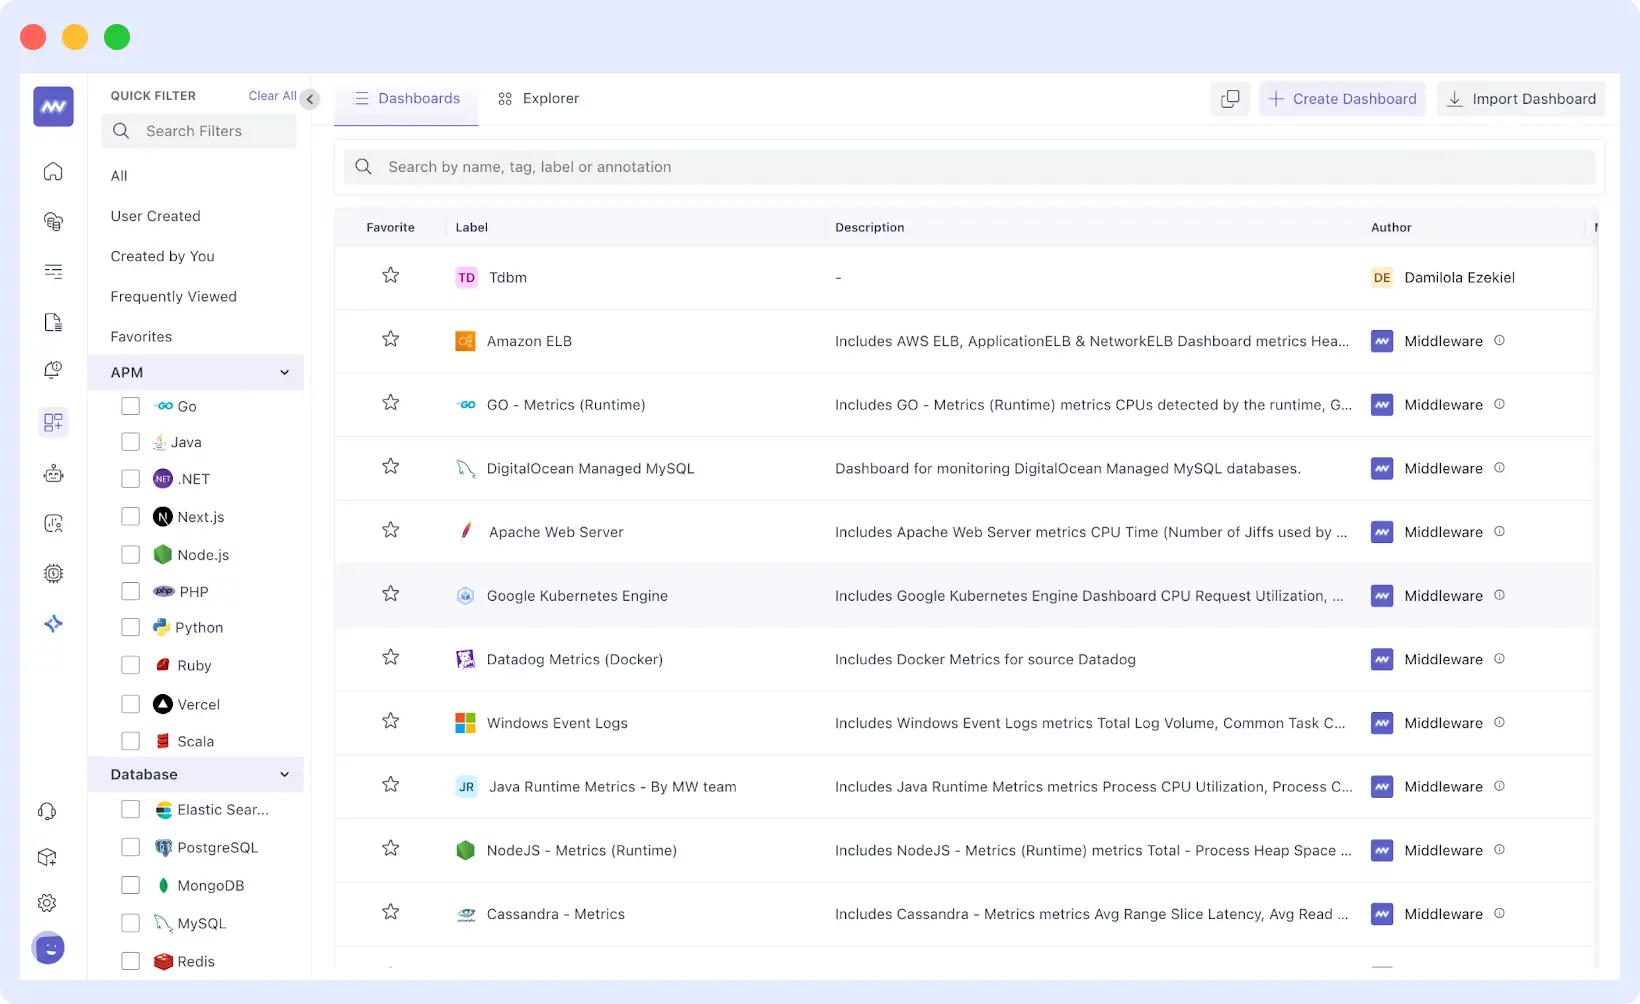
Middleware includes ready-to-use dashboards for physical, virtual, cloud, and Kubernetes infrastructure. You can also build custom dashboards or import existing dashboards from platforms like Datadog to simplify migration.
Server metrics are automatically correlated with logs, making it easier to identify the root cause of performance issues. Middleware also integrates with popular DevOps tools, including GitHub, CI/CD pipelines, Slack, PagerDuty, Jira, Grafana, and Elasticsearch.
Fast Deployment
Middleware automatically discovers hosts and starts collecting metrics within minutes. Its API-first architecture and lightweight deployment make it easy to integrate into existing DevOps workflows, whether you’re running a small engineering team or managing enterprise-scale infrastructure.
If you’d like to compare Middleware with other monitoring solutions, explore our infrastructure monitoring tools guide or see how Middleware compares in our Datadog alternative comparison.
How to choose a server monitoring tool
Whether you land on Middleware or something else, look for these capabilities before committing:
- Coverage of physical, virtual, and containerized infrastructure from a single platform, not separate tools stitched together
- OpenTelemetry support so you’re not locked into a proprietary agent format
- Configurable alert thresholds and baselining, not just static default thresholds that generate noise
- Log and metric correlation in one place, so you’re not switching tools during an incident
- Transparent pricing that doesn’t spike unpredictably as you add hosts or ingest more data
- Fast time to first dashboard, ideally minutes, not a multi-week deployment project
How to conduct a server health check
A server health check is a point-in-time review of the same signals you monitor continuously, useful before a deployment, after an incident, or on a recurring schedule if you don’t have full monitoring in place yet. It matters because it catches resource exhaustion, failing hardware, and misconfigurations before they turn into an outage, and it’s the fastest way to confirm a server is behaving normally before you rule it out as the cause of a problem. If a server is showing signs of trouble, work through these checks in order:
- Check CPU and memory usage against your established baseline, not a generic threshold
- Check disk space and I/O on all mount points for exhaustion or queue buildup
- Check service and application response times for a sudden spike
- Check upstream dependencies (databases, external APIs, message queues) before assuming the server itself is at fault
- Check recent logs and deployments for a correlated change around the time the issue started
Running this manually works for a one-off check. For anything recurring, an automated server health check through continuous monitoring catches the same issues without someone remembering to run it.
Passive vs. active health checks
The checklist above is a passive check: reviewing metrics and logs that already exist. Active checks go a step further by testing the server rather than just observing it.
- Log analysis: Reviewing server and application logs for errors, warnings, or anomalies that metrics alone won’t surface.
- Traffic monitoring: Reviewing incoming request patterns for spikes or anomalies that could indicate a problem or an attack.
- Synthetic transactions: Simulating a real user action, like a login or checkout flow, to confirm the full path works end to end, not just that the server responds.
- Endpoint testing: Sending requests to a dedicated health check endpoint that reports back system load, memory, and operational status in one response, useful for load balancers and automated checks alike.
Most teams run passive checks continuously through monitoring and layer in active checks like synthetic monitoring for the workflows that matter most to the business.
How to check SQL Server health
Database servers need their own health check on top of general server metrics, since a SQL Server instance can be unhealthy even when the underlying OS looks fine. A basic SQL Server health check covers:
- Service and instance status: Confirm the SQL Server service is running and reachable, and check uptime since the last restart.
- Backup status: Verify the most recent full, differential, and log backups completed successfully. A missed backup is often the first sign something’s wrong.
- Error logs: Review the SQL Server error log and Windows Event Viewer for the past few days for recurring warnings.
- Disk space and database file growth: Check free space on data and log volumes, and watch for databases set to autogrow more often than expected.
- CPU and memory: Query system DMVs like
sys.dm_os_sys_memoryandsys.dm_exec_query_statsto see memory pressure and the most CPU-intensive queries. - Blocking and wait statistics: Query
sys.dm_os_wait_statsto see what SQL Server is spending time waiting on, a strong signal for where performance is actually bottlenecked. - Index health: Check for high fragmentation and outdated statistics on frequently queried tables.
- Job and replication status: Confirm SQL Agent jobs completed successfully, and check Always On availability group or replication health if configured.
DBAs typically run these checks through Dynamic Management Views (DMVs), SQL Server Management Studio, or PowerShell scripts scheduled to run on a regular cadence. For continuous coverage, database monitoring automates the same checks and alerts on thresholds you set, instead of waiting for a scheduled manual review.
FAQs
What is a server health check and how often should I run one?
A server health check reviews CPU, memory, disk, network, and service status to ensure everything is running as expected. Run a health check before major deployments, after incidents, and regularly for production environments. Continuous monitoring performs these checks automatically, helping you detect issues before they affect users.
Which server health metrics are the most important?
The most important metrics include CPU usage, memory usage, disk space, disk I/O, network performance, response time, uptime, and error rates. You should also monitor infrastructure dependencies such as databases, load balancers, and third-party APIs.
How do I choose the right server monitoring tool?
Choose a tool that supports your infrastructure, integrates with your existing workflows, and provides real-time monitoring, dashboards, alerts, and log correlation. Look for support for cloud, Kubernetes, and OpenTelemetry if you manage modern applications.
Can server monitoring help improve security?
Yes. Server monitoring can detect unusual activity such as failed login attempts, unauthorized access, certificate expiration, and unexpected traffic spikes. While it doesn’t replace security tools like SIEM or endpoint protection, it helps teams identify and respond to potential threats more quickly.
Why are logs important for server health monitoring?
Logs provide detailed information about server and application activity. While metrics show what is happening, logs help explain why it happened, making troubleshooting faster and more accurate.
What's the difference between physical and virtual server monitoring?
Physical server monitoring includes hardware metrics such as temperature, fan speed, power supply status, and disk health. Virtual server monitoring focuses on operating system and performance metrics, including CPU, memory, storage, network activity, and CPU steal time, since the underlying hardware is managed by the hypervisor or cloud provider.
Should I choose an open-source or commercial monitoring tool?
Open-source tools like Prometheus and Nagios offer flexibility and full control but require more setup and maintenance. Commercial platforms like Middleware provide built-in dashboards, alerting, automation, and support, helping teams get started faster.
What tools are commonly used for server health monitoring?
Organizations use platforms like Middleware for full-stack server monitoring, Prometheus for metrics collection, and built-in operating system tools for basic health checks. Database administrators also use tools such as SQL Server DMVs to monitor database performance and health.