
Synthetic monitoring is the practice of using scripted bots to simulate user interactions, including page loads, login flows, API calls, and checkout transactions, at scheduled intervals from real geographic locations. It runs 24/7 without requiring real user traffic, so your team can catch failures before customers ever encounter them.
Synthetic monitoring and testing tools are the platforms that execute, schedule, and report on these simulated checks. The best ones go beyond simple uptime alerts to cover API assertions, multi-step transaction flows, and browser automation, with alerting that tells you not just what broke but where and why.
This guide covers the 10 best synthetic monitoring and testing tools in 2026, with verified pricing, honest pros and cons, and a clear verdict for each one.
TL;DR
- Best overall: Middleware Synthetic monitoring connected to APM, logs, and traces in one platform. When a check fails, the correlated trace is already in the same view.
- Best value: Site24x7 at $9/month. Gives you 130+ global check locations and AI event correlation at a price no competitor matches.
- Best free plan: Uptime Robot. Fifty free monitors with 5-minute check intervals. Proven since 2010.
- Best for developers: Checkly. Playwright-based, monitoring-as-code, native CI/CD integration.
- Best for existing Datadog or New Relic users: add their native synthetic module rather than introducing a separate tool.
- Best for enterprise: Dynatrace. Davis AI provides automated root cause analysis, not just alert correlation.
- Best open-source: Zabbix. Self-hosted, zero licensing cost, full data ownership.
What is a synthetic monitoring and testing tool?
A synthetic monitoring and testing tool is software that continuously runs scripted simulations of user behavior against your application from external locations. It checks that your URLs respond, your APIs return correct data, and your critical user flows complete end to end, all on a schedule, without waiting for a real user to trigger the path.
If you’re new to the concept, read our detailed guide on synthetic monitoring to understand how it works, common use cases, and why it’s an essential part of modern observability strategies.
The distinction from general testing tools is important. Unit tests and integration tests run in your development environment. Synthetic monitoring runs in production, around the clock, from locations that mirror where your real users are. It is the production-equivalent of your test suite, constantly verifying that what works in CI still works for users right now.
For a deeper dive on how synthetic monitoring fits into a full observability strategy, see our guide: What is synthetic monitoring and how does it work?
The three types of synthetic checks
- Uptime monitoring checks whether a URL returns a successful HTTP response
- API monitoring sends requests to endpoints and validates the response against assertions such as status code, response time, and JSON field values
- Transaction monitoring scripts a full multi-step user flow, such as login, add to cart, and checkout, then validates that each step completes correctly
Quick comparison: all 10 tools
| Tool | Best for | Free plan | Starting price | Check locations | Browser tests |
|---|---|---|---|---|---|
| Middleware | Full observability + synthetics | 14-day trial | Usage-based | Global | Yes |
| Datadog Synthetics | Existing Datadog users | No | $5 per 10k API runs | 30+ | Yes |
| New Relic | Developer observability | Yes (500 checks/mo) | $0.40/GB data | 15+ | Yes |
| Checkly | Developer CI/CD monitoring | Yes (5 checks) | $30/month | 20+ | Yes (Playwright) |
| Pingdom | Simple website uptime | No (30-day trial) | $10/month | 100+ | Yes |
| Site24x7 | Global coverage, best value | No (30-day trial) | $9/month | 130+ | Yes |
| Better Stack | Fast setup + on-call | Yes (10 monitors) | $29/month | 20+ | No |
| Uptime Robot | Free uptime monitoring | Yes (50 monitors) | $7/month | 10+ | No |
| Dynatrace | Enterprise AIOps | No | Custom pricing | 40+ | Yes |
| Zabbix | Self-hosted open-source | Free (open-source) | Free | Self-configured | Limited |
1. Middleware
Best for: teams who need synthetic monitoring connected to APM, logs, and traces in one platform
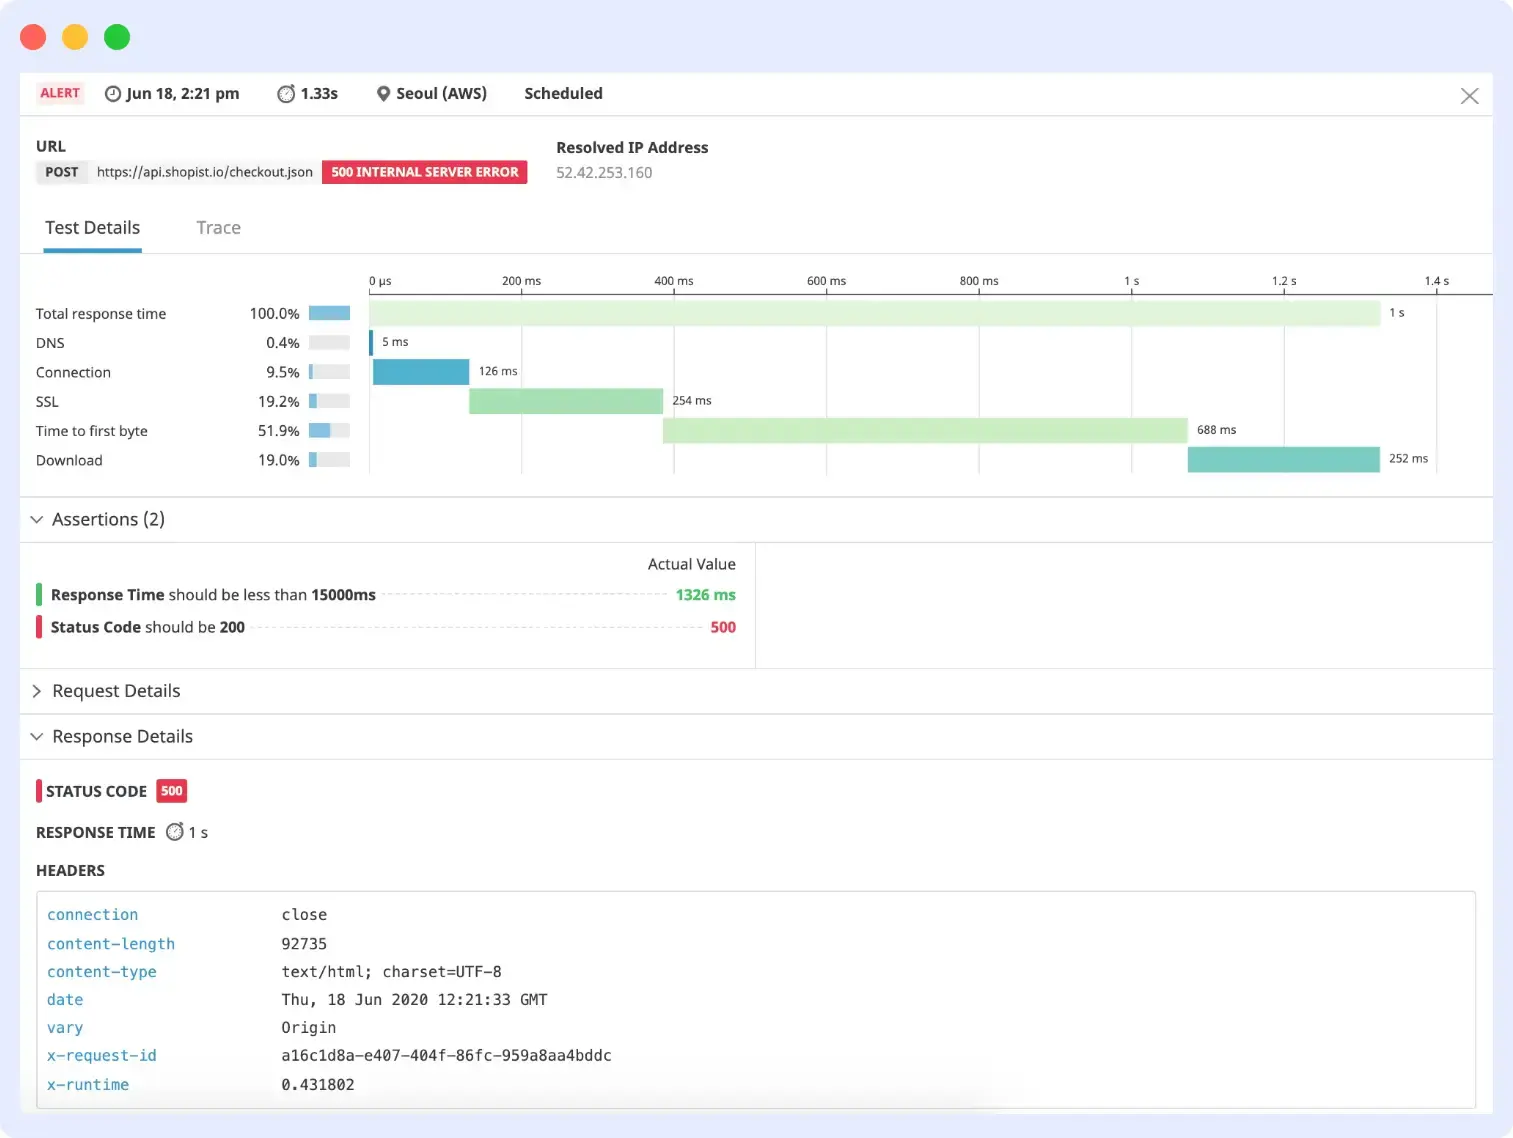
Middleware is a full-stack cloud observability platform where synthetic monitoring is native, not an add-on module. Uptime checks, API monitors, and browser tests share the same data layer as APM distributed traces, infrastructure metrics, and logs. When a synthetic check fails, the correlated trace is already visible in the same view with no need to switch tools or investigate across separate systems.
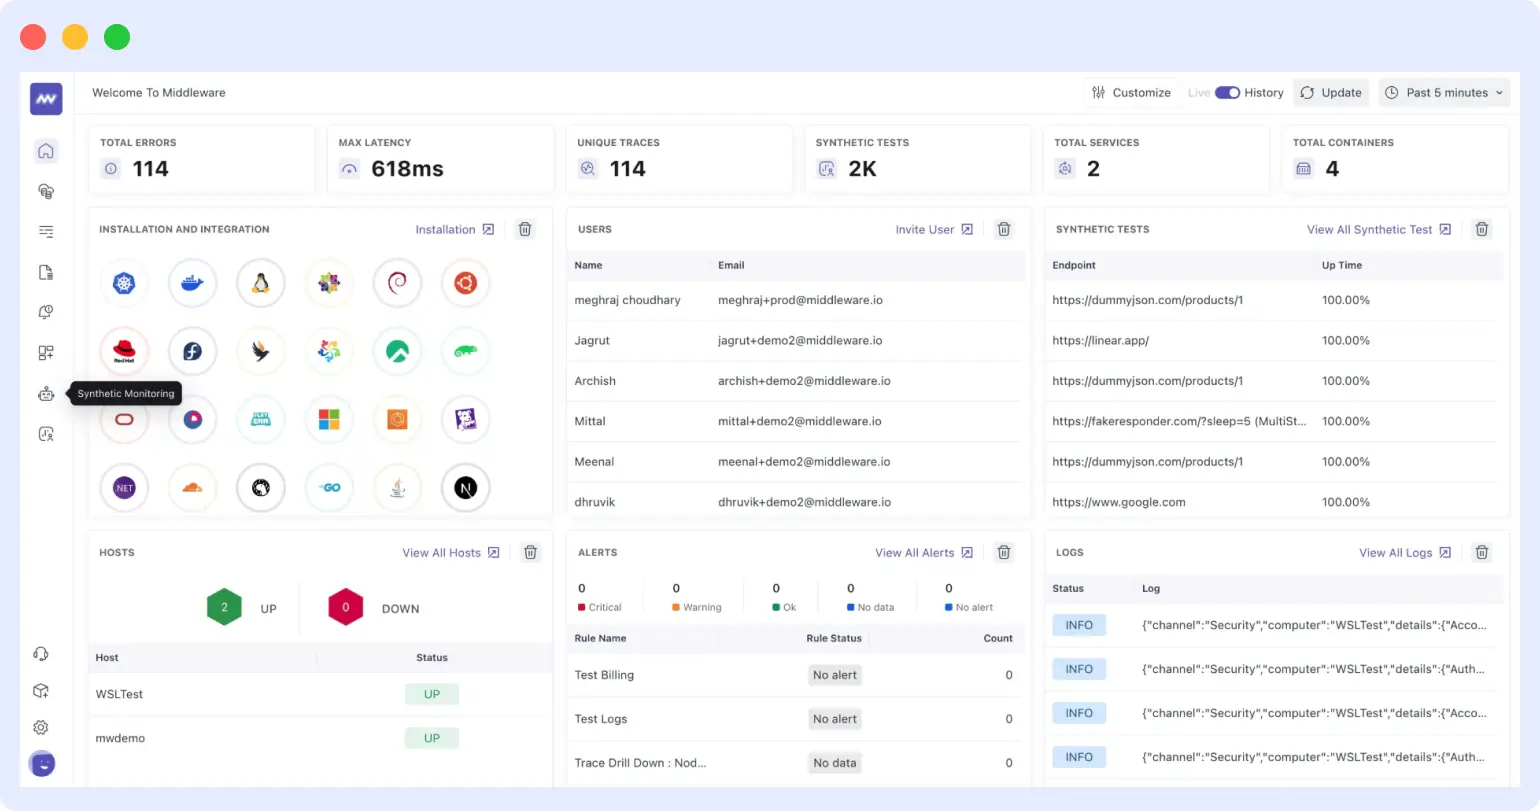
This solves the core problem with every other tool on this list. They alert you that something broke, then leave you to open APM in one tab, logs in another, and piece together what happened manually. Middleware.io removes that context gap by design.
Its OpsAI layer also ingests third-party alerts from Datadog, Grafana, and PagerDuty, correlating them into a single incident so teams deal with one signal per problem instead of ten overlapping notifications from different systems.
Key features
- Synthetic uptime, API, and browser monitoring
- Full APM with distributed tracing (OpenTelemetry native)
- Infrastructure monitoring for hosts, containers, and Kubernetes
- Log management with real-time search and alerting
- OpsAI alert correlation and noise reduction
- Third-party alert ingestion from Datadog, Grafana, and PagerDuty
- Real user monitoring
- Custom dashboards, SLO tracking, and deployment markers
- CI/CD integration and error tracking
Pricing
- Free trial: 14 days, no credit card required
- Pricing model: usage-based with no per-check-run fees
Pros
- Synthetic failures link directly to APM traces in the same view with no tab switching
- OpsAI reduces alert noise across synthetic, infrastructure, and third-party alerts
- Single platform replaces separate tools for uptime, APM, logs, and RUM
- OpenTelemetry native with no vendor lock-in on instrumentation
- Usage-based pricing avoids per-run fee surprises at scale
Cons
- Newer platform with fewer third-party integrations than Datadog currently
- Full value is realized when using the complete observability stack together
Verdict
Middleware is the strongest choice for engineering teams who want synthetic monitoring to be part of observability, not a separate alarm system sitting beside it. If your current setup involves checking one tool for uptime, another for traces, and a third for logs when an incident fires, Middleware.io solves that directly. Start your 14-day free trial.
2. Datadog Synthetics
Best for: teams already running the full Datadog observability stack
Datadog Synthetics is the synthetic monitoring module within the broader Datadog platform. It covers API tests, browser tests, and multistep transaction monitoring, all tied directly into Datadog APM, logs, and dashboards. When a synthetic test fails, the correlated distributed trace is accessible within the same tool.
The important thing to understand about Datadog Synthetics is its pricing model. At $12 per 1,000 browser test runs, a setup of 50 browser checks running every 5 minutes from 3 locations costs over $500 per month on checks alone, before APM, logs, or infrastructure fees. Teams adopting Datadog purely for synthetics will almost always find better value in a purpose-built alternative.
Key features
- API and multistep API tests with full assertion support
- Real browser tests with scripted flows
- 30+ global test locations
- CI/CD integration via Datadog API and GitHub Actions
- AI anomaly detection and automatic baselining
- Full trace correlation with Datadog APM
- Session replay on failing browser tests
- 1,000+ platform integrations
Pricing
- API tests: $5 per 10,000 test runs
- Browser tests: $12 per 1,000 test runs
- Free plan: none, 14-day trial available
To know more about Datadog pricing.
Pros
- Direct APM trace correlation when a synthetic test fails
- Strong global location coverage across 30+ regions
- Tight CI/CD integration for deployment-gated testing
- Session replay for debugging complex browser failures
Cons
- No free plan and per-run costs escalate quickly at scale
- Browser test pricing is expensive versus alternatives
- High configuration complexity for first-time users
- Poor value if you only need synthetics and not the full platform
Verdict
Datadog Synthetics earns its place if your team already uses Datadog for APM and logs. As a standalone synthetic tool, the pricing structure does not justify it. Alternatives deliver comparable capability at significantly lower cost.
3. New Relic Synthetics
Best for: developer teams who want unified observability with a usable free tier
New Relic Synthetics is part of New Relic’s full observability platform. It supports scripted browser monitors, API checks, and multi-location user journey simulation. A genuine differentiator is how New Relic connects performance data to business outcomes, showing for instance how a 200ms regression in page load time correlates with a measurable drop in conversion rate.
The free tier includes 500 synthetic checks per month plus 100GB of data ingest. That is enough to monitor 10 critical endpoints at 30-minute intervals across multiple locations without any payment, making it the most capable free entry point for teams that want APM and synthetics together.
Key features
- Scripted browser monitors using Selenium WebDriver
- Simple and step monitors for API checks
- Multi-location user journey simulation
- Core Web Vitals tracking (LCP, INP, CLS)
- Business impact correlation linking performance to revenue metrics
- 500 synthetic checks per month on the free tier
- 100GB per month free data ingest
- 500+ platform integrations
Pricing
- Free tier: 500 synthetic checks/month and 100GB data/month
- Standard data: $0.40/GB ingested
- Enhanced data: $0.60/GB with extended retention
- Paid plans: custom quote required
To know more about New Relic pricing.
Pros
- Most capable free tier among full-platform observability tools
- Strong correlation between performance data and business outcomes
- Unified platform for APM, logs, infrastructure, and synthetics
- Approachable UI for engineering teams
Cons
- Paid plan pricing requires a custom quote and is not transparent upfront
- Selenium scripting is steeper to learn than Playwright
- Data ingest costs compound faster than they initially appear at low volumes
- Infrastructure monitoring is less capable than Datadog at enterprise scale
Verdict
New Relic is the best free starting point for teams that want APM and synthetics together. The 500 free checks per month cover genuine production monitoring needs. Verify pricing assumptions carefully before scaling since data costs grow faster than they initially appear.
4. Checkly
Best for: developer-first teams who want monitoring-as-code with Playwright
Checkly is built on the principle that monitoring should live as code alongside your application. Engineers write checks in JavaScript or TypeScript using Playwright for browser tests and Node.js for API checks. Those checks sit in version control, pass through code review, and run in CI/CD pipelines before and after deployments.
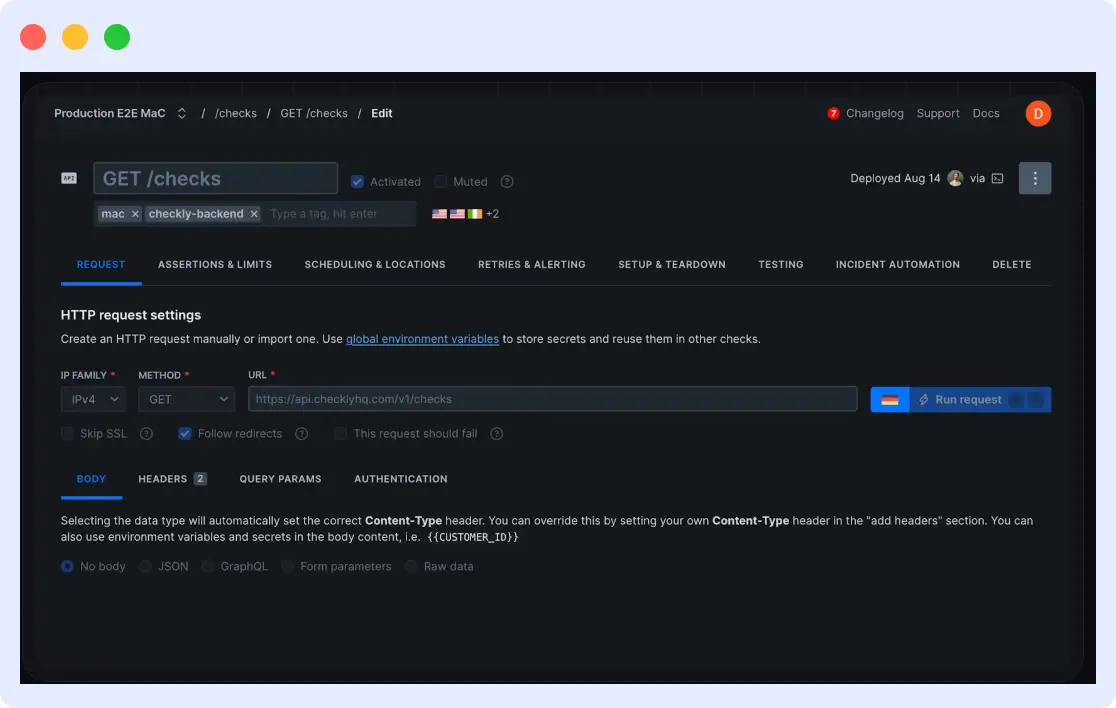
The practical difference this makes is that the same engineer who writes a new feature writes the check that validates it in production. When that check fails in a deployment pipeline, the build stops before broken code ships. No other tool on this list implements this workflow as cleanly.
Key features
- Playwright-based browser tests
- API checks with full assertion support and request chaining
- Monitoring-as-code via the Checkly CLI
- Native GitHub, GitLab, and Bitbucket CI/CD integration
- 20+ global check locations
- Smart retry logic to reduce flaky alert noise
- Failure screenshots and traces attached to every alert
- Parallel check execution
Pricing
- Free tier: 5 checks with Checkly CLI access
- Starter: $30/month for 15 checks and 20 locations
- Team: $64/month billed annually
- 14-day free trial available
Pros
- Best developer experience for code-based monitoring on the market
- Playwright is modern, widely understood, and well maintained
- Checks travel through the same review process as application code
- Clean dashboard with detailed failure context on every alert
Cons
- Per-check pricing becomes expensive for large monitor sets at scale
- No infrastructure or APM monitoring, purely synthetic
- Non-engineers cannot configure checks without JavaScript knowledge
- Limited alerting channels on the free plan
Verdict
Checkly is the definitive choice for engineering teams who write tests and want to extend that discipline to production monitoring. It is not a full observability platform, but for Playwright-based monitoring as code, nothing comes close.
5. Pingdom
Best for: non-technical teams who need reliable website uptime monitoring
Pingdom by SolarWinds is one of the longest-running names in website monitoring. It offers uptime checks from 100+ global locations, the widest geographic coverage among tools at this price tier, along with transaction monitoring, page speed analysis, and real user monitoring as an add-on.
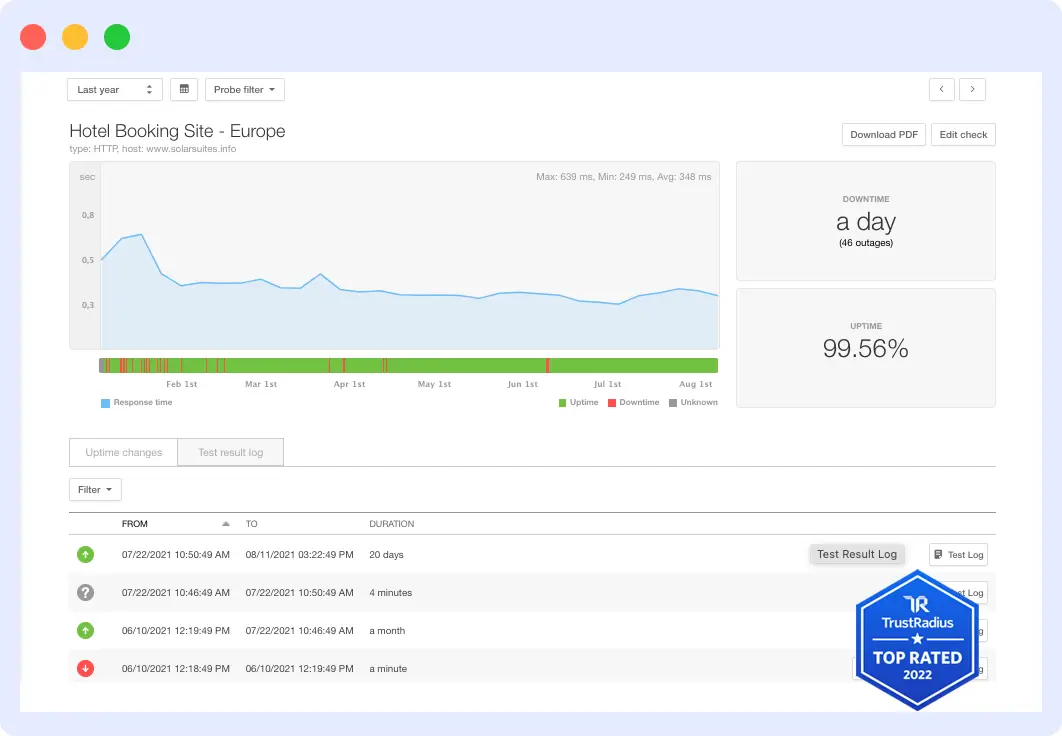
Its primary value is simplicity. Teams can set up their first monitor in minutes without any technical background. The 100+ location count genuinely matters for organizations with users across emerging markets, where tools with only 15 to 20 locations will miss regional performance degradation entirely.
Key features
- Uptime monitoring from 100+ global locations
- Transaction monitoring for multi-step user flows
- Page speed monitoring with waterfall analysis
- Real user monitoring as a separate add-on
- Status page builder
- Root cause analysis reports
- Slack, PagerDuty, and OpsGenie alert integrations
- Mobile app for on-call teams
Pricing
- Synthetic monitoring: from $10/month
- RUM add-on: from $10/month separately
- Free plan: none, 30-day trial available
Pros
- 100+ test locations with the widest global coverage at this price point
- Extremely fast setup with no technical expertise required
- Mature, proven product with a long reliability track record
- Intuitive dashboard and reporting for non-technical teams
Cons
- No free plan, only a 30-day trial
- Pricing scales steeply as monitor count grows
- Missing Core Web Vitals in performance monitoring
- Status pages have limited customization options
Verdict
Pingdom is the right tool for marketing teams, content businesses, and anyone who needs reliable uptime alerts without engineering tooling. Teams who need code-level test control, Core Web Vitals tracking, or APM integration should look elsewhere.
6. Site24x7
Best for: global coverage at small-to-mid scale on a tight budget
Site24x7 is a unified monitoring platform from ManageEngine covering web, API, transaction, real user, network, cloud, and server monitoring. At $9/month billed annually, it provides access to 130+ monitoring locations worldwide. That is the widest geographic coverage available at any price under $15/month across all tools in this comparison.
In early 2026, Site24x7 added AI event correlation that automatically groups related alerts from web checks, server metrics, and network events into a single incident. This capability previously required enterprise-tier platforms at multiples of this price.
Key features
- 130+ global monitoring locations, the most per dollar on this list
- Web, API, and multi-step transaction monitoring
- Real user monitoring built in
- Application performance monitoring
- Network and infrastructure monitoring
- AI event correlation added in 2026
- AWS, Azure, and GCP cloud integrations
- Slack, PagerDuty, Jira, and ServiceNow alerting
Pricing
- Starter: $9/month billed annually
- Pro: $35/month billed annually
- Free plan: none, 30-day trial available
- Independently rated 4.6/5 in 2026 reviews
Pros
- 130+ locations and multi-layer monitoring at $9/month, unmatched value
- AI event correlation added in 2026 without a price increase
- Covers web, mobile, network, cloud, and server in one subscription
- Strong cloud platform integrations out of the box
Cons
- Dense UI requires several hours of onboarding to navigate comfortably
- Some advanced features are gated to higher pricing tiers
- No free plan, trial only
- Customization depth is limited versus enterprise tools
Verdict
Site24x7 is the most value-dense tool in this comparison. For teams that need global synthetic coverage, multi-layer monitoring, and AI-assisted alerting without enterprise pricing, $9/month is genuinely hard to beat. Budget a few hours for initial configuration.
7. Better Stack
Best for: teams who want uptime monitoring, on-call scheduling, and a status page in one product
Better Stack combines uptime monitoring, on-call scheduling, and status pages into one product. Teams can go from sign-up to first alert in under 10 minutes. Every alert includes a screenshot of the failing page, the HTTP response body, and an incident timeline, eliminating the common experience of receiving only a URL and a status code with no context for triage.
Key features
- Uptime, SSL, keyword, ping, DNS, and port monitoring
- Every alert includes a screenshot, response body, and incident timeline
- On-call scheduling and escalation policies built in
- Public and private status pages
- Unlimited phone and SMS alerts on paid plans
- 30-second check intervals on paid plans
- Slack, Teams, and PagerDuty integrations
- AI SRE features added in 2026
Pricing
- Free: 10 monitors, 3-minute checks, 1 status page
- Freelancer: $29/month for 50 monitors and 30-second checks
- Free plan is available immediately with no separate trial period needed
Pros
- Monitoring, on-call, and status page in one product without extra tools
- Richest alert context of any uptime tool with a screenshot included in every notification
- Fastest time to first alert of any tool tested at under 10 minutes from signup
- Generous free tier with genuinely useful check frequency
Cons
- No browser automation or transaction monitoring, availability checks only
- No infrastructure monitoring for CPU, memory, or disk
- Pricing increases significantly as monitor counts scale
- Not suited for code-driven monitoring workflows
Verdict
Better Stack is the most complete incident response toolkit at this price point. If your primary need is knowing when things are down, escalating to the right person, and communicating status to users, it handles all three better than any single-purpose tool. The absence of browser and transaction monitoring is its clear ceiling.
8. Uptime Robot
Best for: solo developers, indie projects, and early-stage startups that need free monitoring
Uptime Robot has provided HTTP uptime monitoring since 2010 and built its reputation on one principle: a free plan that actually works in production. Fifty monitors with 5-minute checks and email alerts at no cost covers the monitoring needs of most early-stage projects without any payment required.
The 5-minute check interval is its most significant limitation. An outage that self-resolves in under 5 minutes will never trigger an alert. For businesses where even 3 minutes of downtime is material, the paid plan’s 1-minute interval is necessary. For the majority of use cases where detecting an outage within 5 minutes is sufficient, the free plan is genuinely adequate.
Key features
- HTTP/S, keyword, ping, and port monitoring
- SSL certificate expiry monitoring
- 50 free monitors with email alerts included
- Status page on the free plan
- 1-minute check intervals on paid plans
- SMS and phone call alerts on paid plans
- Slack and Webhook integrations
- 10+ check locations
Pricing
- Free: 50 monitors, 5-minute intervals, email alerts, 1 status page
- Solo: $7/month for 50 monitors with 1-minute intervals and SMS alerts
- Team: $14/month for 100 monitors and additional team members
Pros
- 50 free monitors, the most generous free tier for uptime monitoring
- 15+ years of operational history and proven reliability
- Immediate setup with no credit card and no configuration overhead
- Status page included even on the free plan
Cons
- 5-minute minimum check interval on free plan misses short outages
- SMS alert cap of 20 calls per month on the cheapest paid tier
- No browser tests or transaction monitoring
- Limited global location coverage versus Site24x7 or Pingdom
Verdict
Uptime Robot is the correct starting point for any team not yet ready to pay for monitoring. The free plan covers genuine production needs. When 5-minute detection gaps start to matter, or you need transaction testing, upgrade to a more capable platform.
9. Dynatrace
Best for: large enterprises running complex distributed systems who need automated root cause analysis
Dynatrace is an enterprise observability platform centered on Davis AI, which automatically identifies the root cause of performance problems. It does not just tell you which service failed. It tells you which deployment or infrastructure event caused it and which downstream services were affected. Its synthetic monitoring module covers HTTP, browser, and clickpath tests, all integrated with full-stack distributed tracing.
The key difference between Dynatrace and Datadog at the enterprise level is this: Datadog surfaces correlated signals and lets engineers diagnose the cause. Davis AI produces a single, specific root cause determination with a full causal chain. For large operations teams where alert volume is the dominant problem, this distinction is significant.
Key features
- HTTP, browser, and clickpath synthetic monitors
- Davis AI automated root cause analysis
- 40+ global monitoring locations
- Full distributed tracing integration
- Auto-baselining with no manual alert threshold configuration needed
- Private synthetic locations for internal application monitoring
- ITIL-aligned alerting and ITSM integrations with ServiceNow and Jira
- Kubernetes, cloud, and mainframe monitoring
Pricing
- Pricing model: custom, contact sales for a quote
- Free plan: none
- Trial: 15-day free trial available
Pros
- Davis AI eliminates manual alert threshold configuration entirely
- Automated root cause identification rather than just alert correlation
- Private monitoring locations for internal and air-gapped applications
- Strong enterprise compliance posture including SOC 2, ISO 27001, and HIPAA
Cons
- Opaque pricing with custom quotes only and no self-serve options
- Significant configuration investment often required at deployment
- Overkill and cost-prohibitive for teams below enterprise scale
- Steep learning curve for teams new to full-platform observability
Verdict
Dynatrace is the right choice for enterprises managing mission-critical infrastructure where alert volume and root cause speed are the dominant problems. For everyone else, the pricing, complexity, and configuration investment are difficult to justify.
10. Zabbix
Best for: teams with dedicated DevOps capacity who need self-hosted, zero-cost monitoring
Zabbix is an open-source monitoring platform in active development since 2001. It supports web scenario monitoring (synthetic HTTP checks), agent-based infrastructure monitoring, SNMP network monitoring, and custom alerting, all self-hosted with no SaaS dependency and no licensing fee regardless of scale.
The true cost of Zabbix is not the license fee but the operational overhead. A production Zabbix deployment typically requires 2 to 5 days of initial setup, ongoing database maintenance, upgrade management, and custom scripting for any functionality beyond built-in checks. Teams that account for these costs honestly often find a paid tool at $20/month is cheaper than the engineering time Zabbix requires.
Key features
- Web scenario monitoring for synthetic HTTP checks
- Agent-based host and service monitoring
- SNMP, IPMI, and JMX protocol support
- Distributed monitoring using Zabbix proxies
- High-availability server configuration
- 7,000+ community monitoring templates
- Custom alert actions and escalation scripts
- No vendor lock-in with all data stored in your own database
Pricing
- License: free under Apache 2.0 open-source
- Hosting: self-managed server, database, and compute costs only
- Support: community (free) or commercial Zabbix support contracts
Pros
- Completely free with no per-monitor fees regardless of scale
- Full data ownership with nothing leaving your own infrastructure
- Infinitely customizable for teams with engineering capacity
- Large, active community with an extensive template library
Cons
- High operational overhead where setup and maintenance require dedicated DevOps time
- Modern browser automation via Playwright is not natively supported
- UI is dated and steep for engineers unfamiliar with traditional monitoring tools
- No managed cloud option so you own the entire operational burden
Verdict
Zabbix is correct for teams with strong infrastructure engineering capacity, a data sovereignty requirement, or a genuine zero-budget constraint. For modern synthetic testing needs such as Playwright browser flows, API assertions, and CI/CD integration, purpose-built tools are more capable with less operational cost.
How to choose the right synthetic monitoring tool
The right tool depends on what you need to detect, how your team operates, and how much context you need when something fails.
| If your team… | Best fit |
|---|---|
| Needs uptime alerts only | Uptime Robot (free) or Better Stack (free tier). Setup takes under 10 minutes. |
| Wants monitoring-as-code in CI/CD | Checkly. Write Playwright checks in TypeScript, commit to your repo, and run them in pipelines. |
| Needs synthetics plus APM and logs in one tool | Middleware link to traces without switching tools. |
| Already uses Datadog or New Relic | Add their native synthetic module rather than introducing a separate tool. |
| Wants maximum value per dollar | Site24x7 at $9/month with 130+ locations, AI event correlation, and multi-layer monitoring. |
| Needs on-premise deployment | Zabbix (open-source, self-hosted) or ManageEngine ($199/year with on-prem APM). |
| Needs enterprise AIOps | Dynatrace. Davis AI provides automated root cause analysis, not just alert correlation. |
A note on total cost of ownership: Tools like Datadog and Dynatrace appear comprehensive but carry hidden costs per run pricing, per-host licensing, and separate modules for APM, synthetics, and logs each add to the bill. Factor in the time your team spends switching context between tools when calculating real cost.
Get Started with Synthetic Monitoring
Middleware’s synthetic monitoring is available on the Free Trial plan, 20,000 checks per month, no credit card required. Set up API checks in minutes and correlate results with traces, logs, and infrastructure metrics from a single platform.
FAQs
What is a synthetic monitoring tool?
A synthetic monitoring tool uses automated scripts and bots to simulate real user interactions with websites, APIs, and applications. These tests run continuously from multiple geographic locations to detect outages, slow performance, and broken user journeys before customers are affected.
Why is synthetic monitoring important?
Synthetic monitoring helps teams identify performance issues before users encounter them. It provides proactive visibility into website availability, API reliability, application performance, and critical business transactions such as logins, registrations, and checkout flows.
What is the difference between synthetic monitoring and synthetic testing?
Synthetic monitoring continuously runs automated tests in production to detect issues over time. Synthetic testing focuses on validating application functionality, performance, and workflows during development, staging, or deployment processes. Many modern platforms combine both capabilities.
Can synthetic monitoring monitor APIs?
Yes. Modern synthetic monitoring tools can continuously test REST APIs, GraphQL endpoints, and microservices. They validate response times, status codes, payload accuracy, authentication, and business logic to ensure APIs remain available and functional.
How often should synthetic monitoring tests run?
The ideal frequency depends on business requirements. Critical customer-facing applications typically run checks every 1–5 minutes, while less critical services may run every 15–30 minutes. High-frequency monitoring enables faster incident detection and response.
What are browser-based synthetic tests?
Browser-based synthetic tests use real browsers to simulate complete user interactions such as logging in, searching products, filling forms, and completing transactions. These tests validate both frontend performance and application functionality.
How does Middleware synthetic monitoring work?
Middleware synthetic monitoring enables teams to monitor websites, APIs, and user journeys from multiple locations while correlating synthetic test failures with logs, traces, infrastructure metrics, and application performance data. This unified observability approach helps teams identify root causes faster and reduce troubleshooting time.
Can synthetic monitoring help improve customer experience?
Yes. Synthetic monitoring proactively identifies performance bottlenecks, outages, and transaction failures before users are impacted. This helps organizations improve application reliability, maintain SLAs, and deliver a better customer experience.