Summary: As distributed systems grow more complex, engineering teams need more than dashboards; they need platforms that correlate metrics, logs, and traces in real time to surface root causes fast. The observability tools market is projected to reach $4.1 billion by 2028, yet most teams still struggle with alert fatigue, siloed data, and tools that don’t scale. This guide cuts through the noise with an honest, technically grounded comparison of the top 10 observability platforms in 2026.
TL;DR
- Observability = understanding why a system is behaving a certain way, not just that something is wrong.
- The three pillars are metrics, logs, and traces any tool worth using handles all three.
- Middleware leads for full-stack visibility with flexible, usage-based pricing.
- Datadog and Dynatrace are enterprise-grade but expensive at scale.
- Grafana and SigNoz are strong open-source options with active ecosystems.
- Always run a free trial before committing pricing structures vary wildly.
What is an observability tool?
An observability tool is a software platform that helps engineering teams understand the internal state of their systems by collecting, correlating, and analyzing telemetry data in real time.
Unlike traditional monitoring which tells you something broke observability tells you why it broke, even in systems you’ve never debugged before. For a deeper dive, see our guide on what observability is and why it matters.
The three pillars of observability
| Pillar | What It Captures | Example Use Case |
|---|---|---|
| Metrics | KPIs like CPU usage, latency, error rate | Detect a memory spike across a pod cluster |
| Logs | Timestamped records of individual system events | Trace a failed API call to a specific microservice error |
| Traces | End-to-end request flow across services | Pinpoint which service in a chain is adding 800ms of latency |
The best observability platforms don’t just collect these independently they correlate them so you can jump from a spike in error rate directly to the offending trace and its surrounding logs.
Top 10 observability tools in 2026
1. Middleware
Best for Full-Stack Observability at Flexible Scale
Middleware is a full-stack observability platform that made it’s way in our list of observability tools because of it’s unique market positioning of the ability to use just only the features you need and be charged only for it and not others.
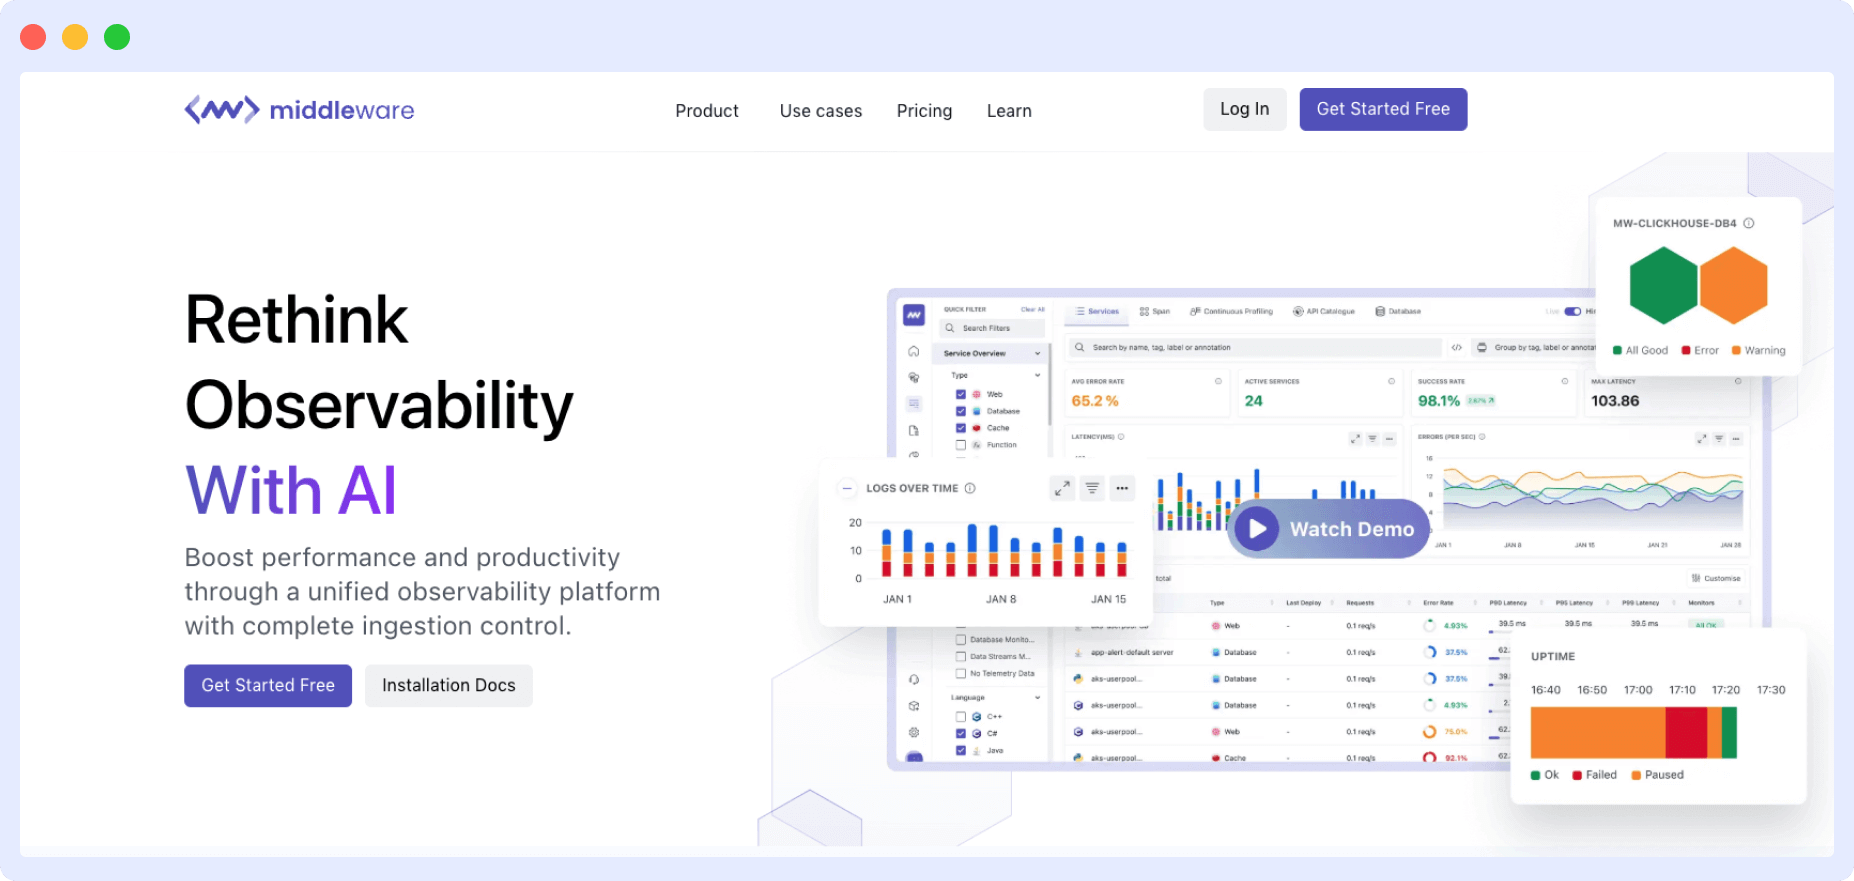
The platform integrates, aggregates, and analyzes data from multiple sources, creating logs, traces, and monitoring metrics to help organizations better understand their infrastructure, applications, and systems.
Middleware takes an end-to-end approach to observability, offering a long list of monitoring tools for your infrastructure, logs, application performance, APIs, databases, serverless applications, containers, and real users.
Depending on your requirements, you can deploy the platform to use all its capabilities or even a single one.
i. Unified monitoring
Middleware provides a unified view of metrics, logs, and traces, consolidating data from multiple sources into a single platform for easy analysis and troubleshooting.
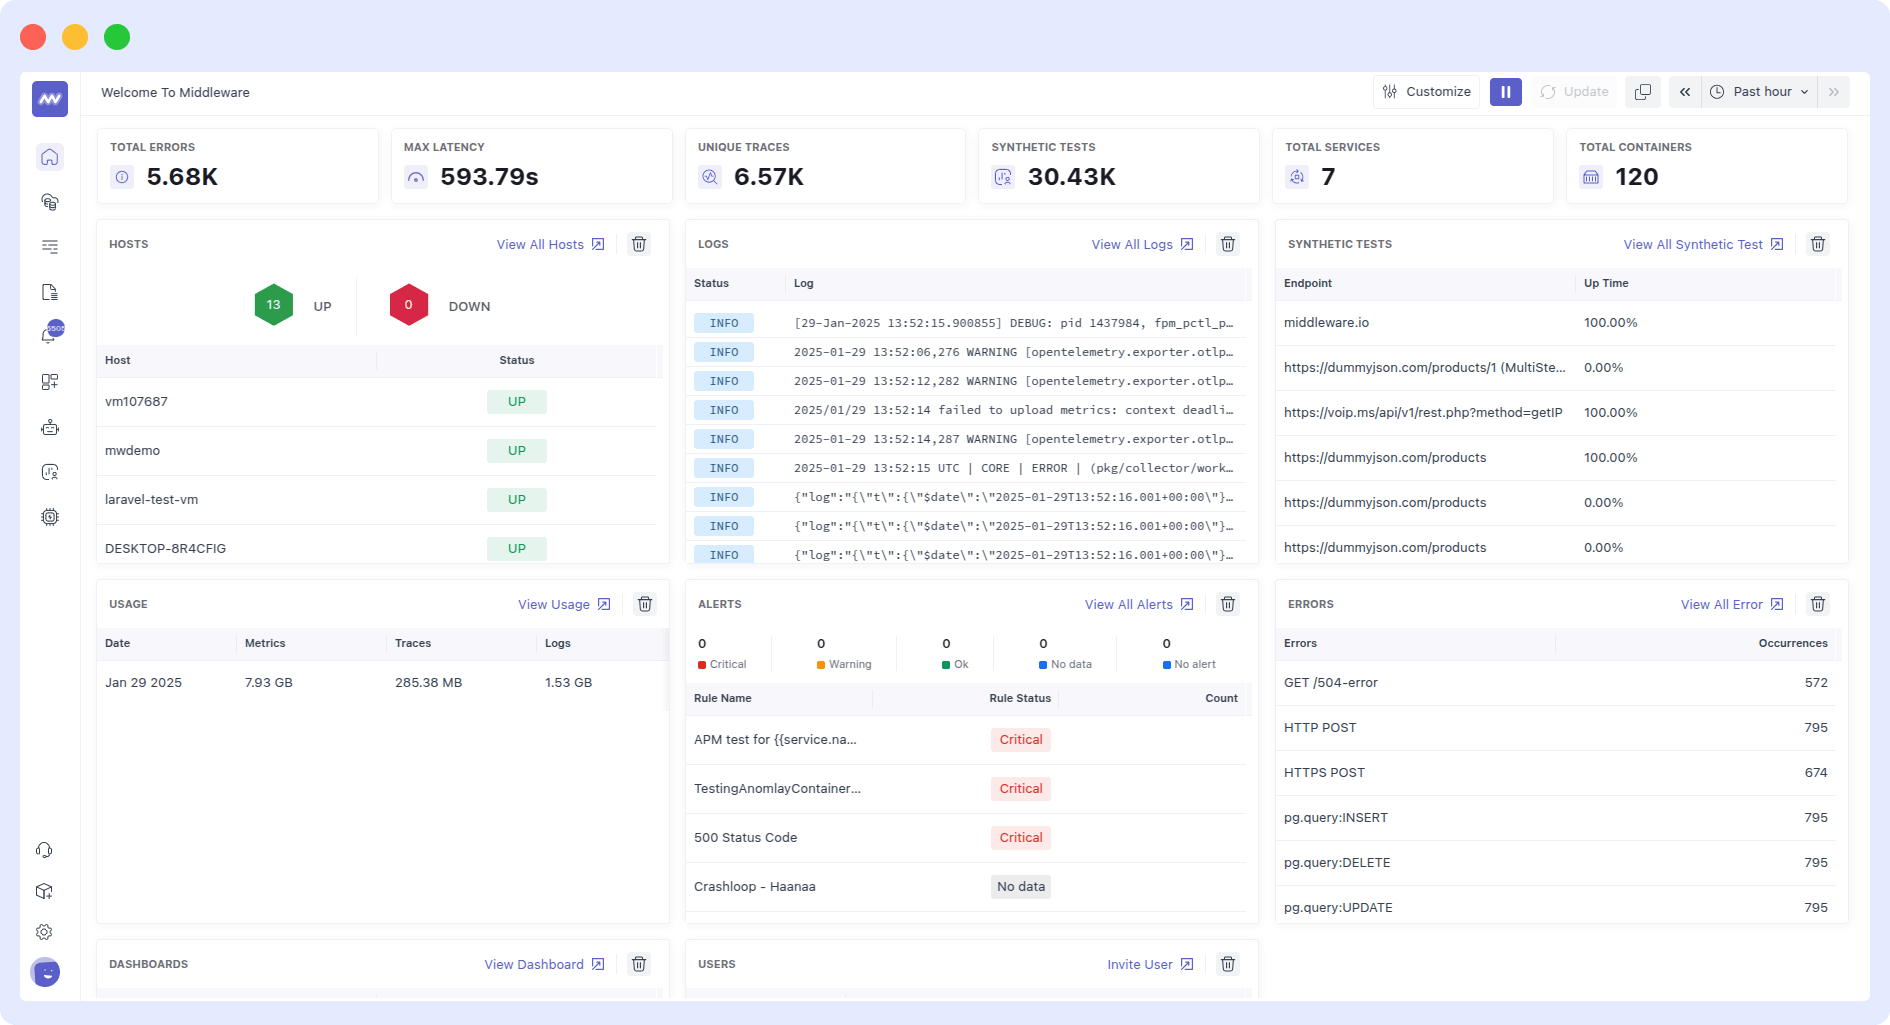
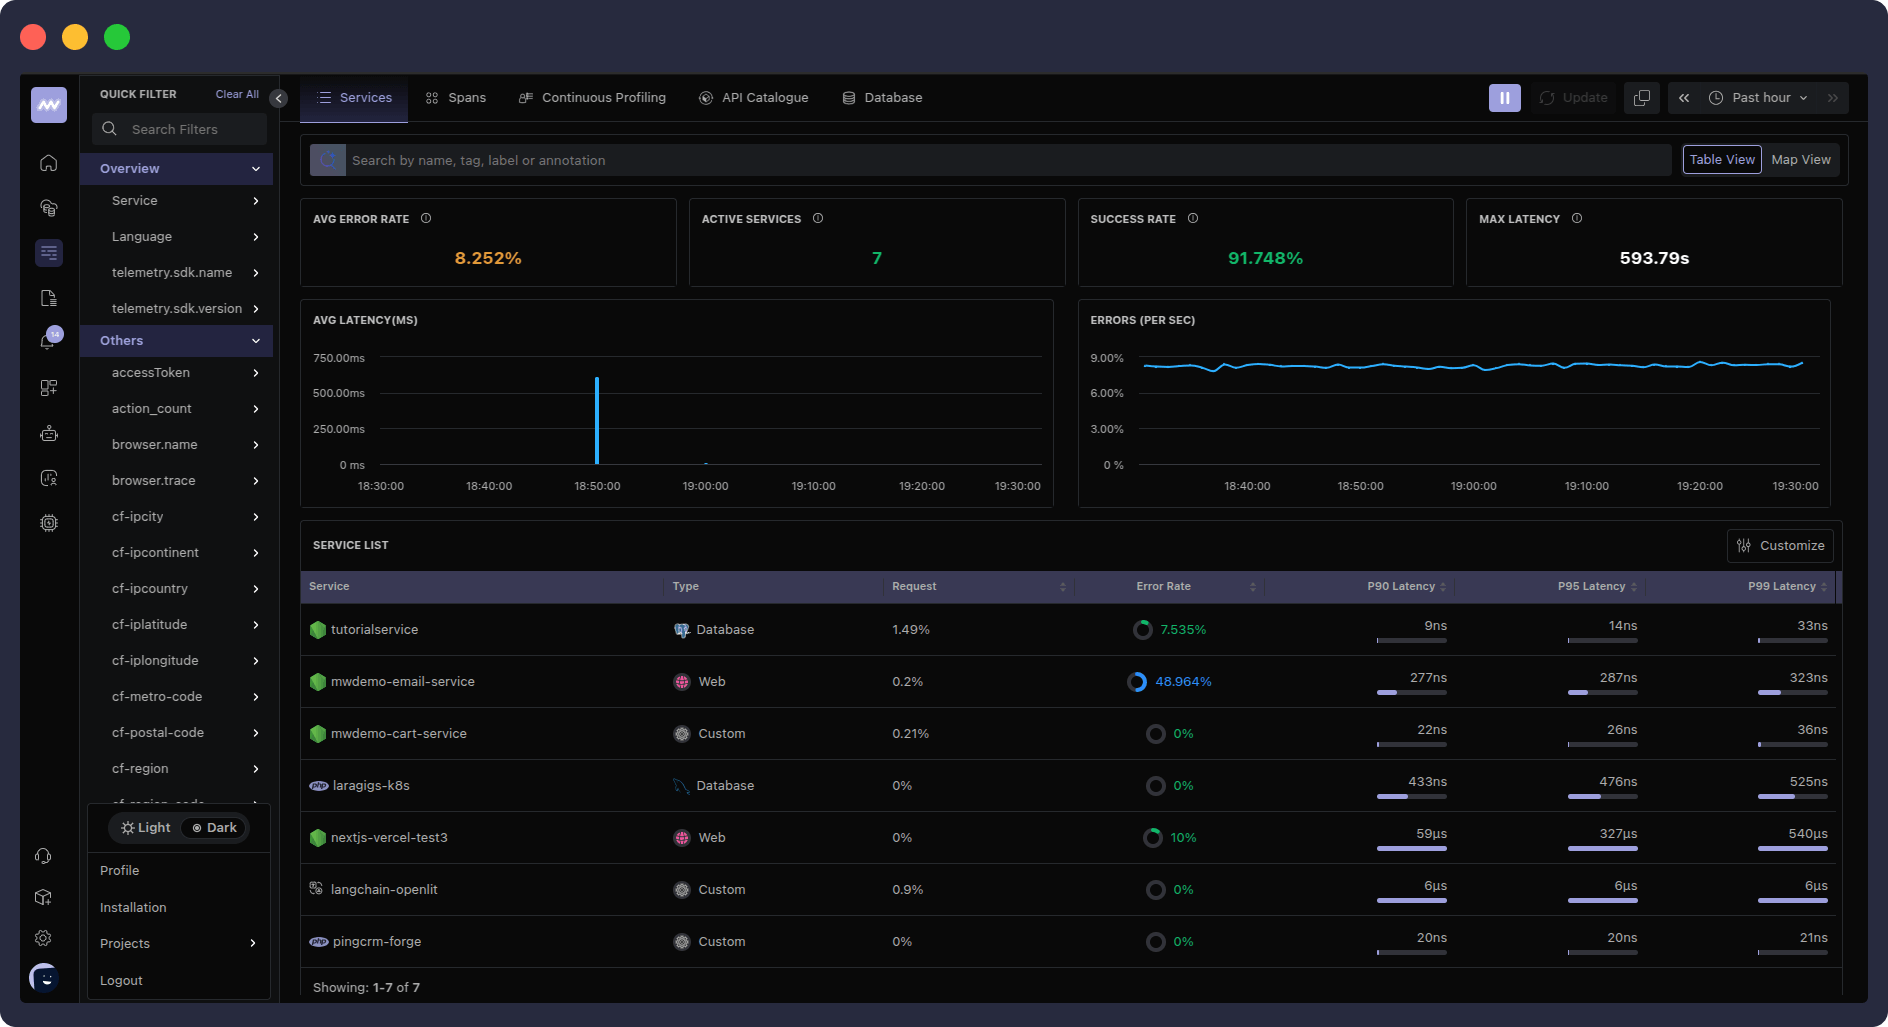
ii. APM dashboard
Middleware also provides a robust Application Performance Monitoring (APM) dashboard that lets you gain real-time insights into distributed traces and correlate them with other observability data.
To maximize performance, you can connect these traces to several infrastructure logs, processes, and metrics, such as app usage patterns, response times, error rates, and more.
The metrics screen offers comprehensive monitoring of system and application metrics, with customizable graphs and visualizations to track performance over time.
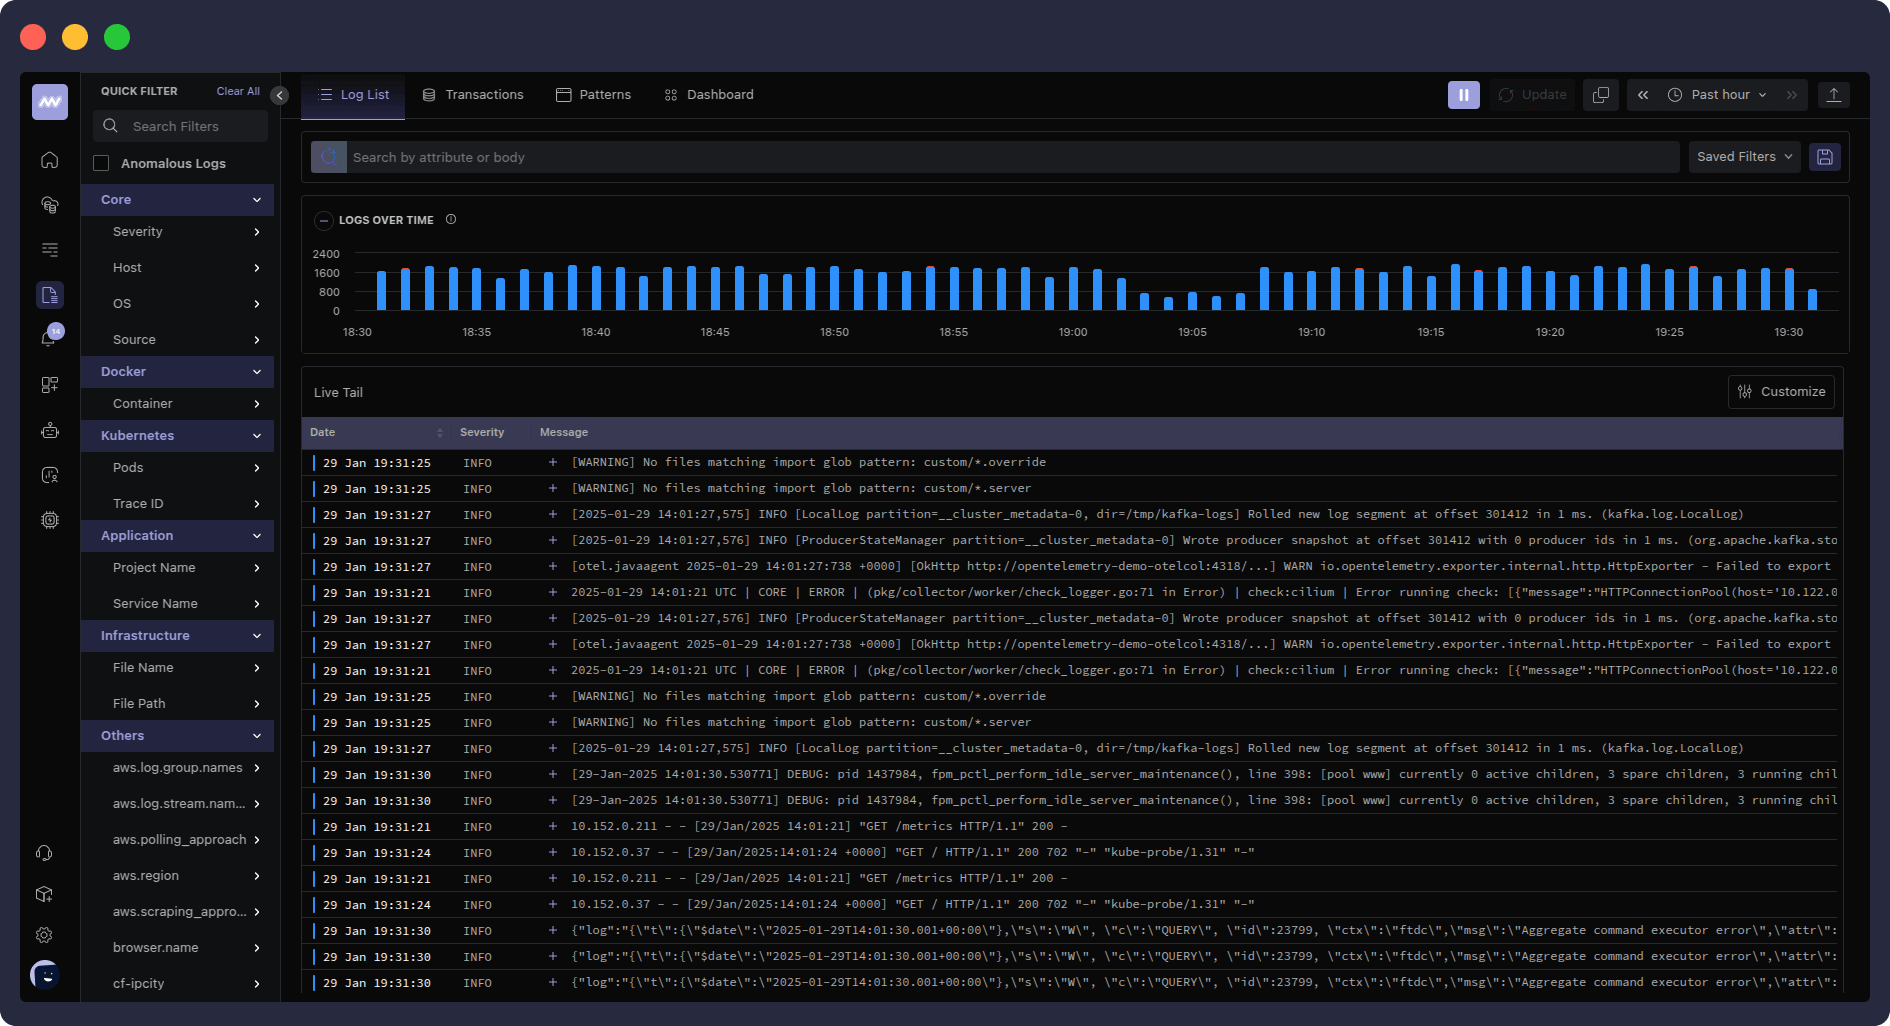
iii. End-to-end visibility into logs
The logs dashboard provides a centralized hub for monitoring and analyzing log data, with powerful search and filtering capabilities for efficient troubleshooting.
This enables distributed tracing across microservices architectures, providing end-to-end visibility into request flows and performance bottlenecks.
iv. Default and custom dashboards
Users can create custom dashboards tailored to their specific needs, which allow them to visualize important metrics and gain insights into application and infrastructure performance.
v. OpsAI: From Alert to Fix Without Waking Your On-Call Team
OpsAI is Middleware’s built-in AI SRE agent and it’s what separates Middleware from most observability platforms on this list. Traditional monitoring tells you something broke. OpsAI tells you why, traces it to the exact line of code, and opens a pull request with the fix.
What OpsAI handles:
Log pattern analysis: automatically correlates log anomalies with infrastructure and application events to accelerate RCA
Automated error fixing: detects errors from APM traces and RUM sessions, identifies root cause, and opens a PR with a targeted fix
Kubernetes debugging and auto-fix: choose Auto RCA (OpsAI suggests fixes for review) or Auto Fix (OpsAI applies them directly, zero intervention)
Third-party alert ingestion: ingests alerts from Datadog and Grafana, runs investigations using their metrics and logs, all inside Middleware without migrating anything
Anomaly detection: AI-powered detection across applications, infrastructure, and logs; flags real problems and filters false positives
“Middleware reduced the time spent debugging and resolving issues by nearly 90%. What sets their AI apart is that it does not stop at detecting issues — it actually helps fix problems in production.”
Nico Laqua, CEO at Corgi
Pricing
- Free Trial: 14-day free trial with unlimited data ingestion across APM, Log and Infrastructure monitoring, RUM, Synthetic monitoring, Database, and Serverless monitoring.
- Pay-as-you-go: $0.3 per GB of metrics, logs, and traces (pay-only-for-what-you-use model). Features include everything in the Free plan, with additional features like ingestion control and data pipeline, a dedicated Slack channel, and more.
- Enterprise Plan: Ideal for large-scale deployments. Custom pricing is also available.
Pros
- Middleware provides a simplified installation and setup process.
- AI-driven anomaly detection is also provided for proactive issue resolution.
- Customizable dashboards are an added bonus, along with alerts tailored to specific use cases.
- Scalable architecture that is capable of handling large volumes of data.
- Also provided is a flexible pricing model based on actual usage, providing you with an end-to-end observability platform at the price of an observability tool.
Cons
- A somewhat slight learning curve exists for advanced features and configuration.
- Users may need additional support or training to leverage the platform’s capabilities that extend beyond just a normal observability or monitoring tool.
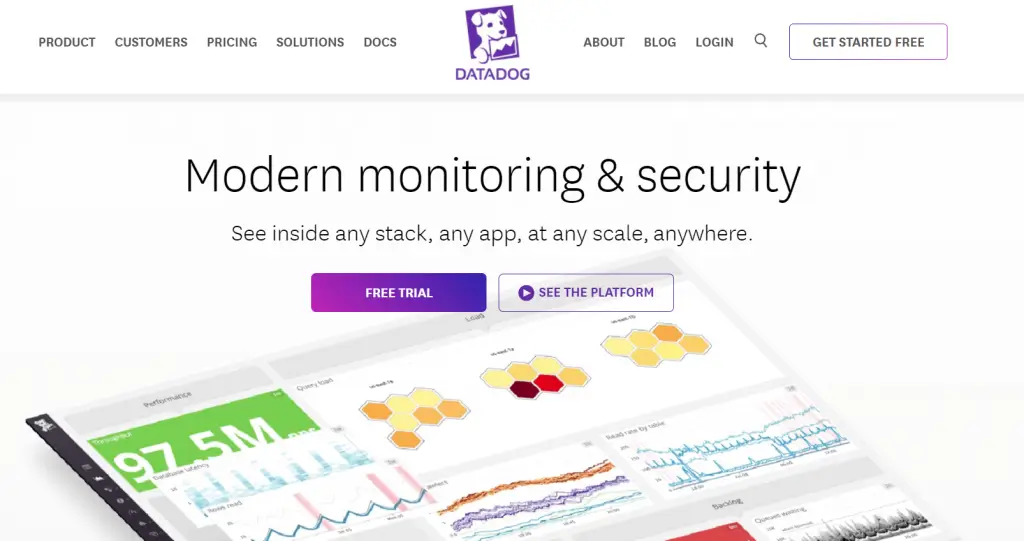
2. Datadog
Best for Enterprise Cloud-Scale Monitoring
Datadog is a cloud-scale monitoring and analytics platform that provides comprehensive observability across modern cloud-native environments. Datadog also offers real-time insights into metrics, logs, traces, and events, allowing organizations to gain deep visibility into their infrastructure and applications.
Key features
- Centralized monitoring of metrics, logs, traces, and events for holistic observability.
- Custom alerting for issues in infrastructure, applications, or services.
- Extensive integrations with CI/CD platforms, notification systems, and collaboration tools.
- Support monitoring of cloud services, containers, and microservices architectures.
Datadog Pricing
- Free: Up to 5 hosts, 1-day metric retention, and standard events and metrics.
- Pro: Starting at $15 per monthly host (billed annually) or $18 on-demand. Includes 15-month metric retention, custom metrics, and alerts.
- Enterprise: Starting at $23 per host per month (billed annually) or $27 on-demand. Adds advanced features like machine learning-based alerts, live processes, and correlations.
Pros
- User-friendly interface with intuitive navigation and dashboard customization options.
- Robust alerting and visualization features enable users to identify and respond to performance issues quickly.
- Scalable architecture capable of handling large volumes of data, making it suitable for enterprises and high-traffic applications.
Cons
- Pricing may be prohibitive for small to medium-sized organizations, especially those with large data volumes.
- Some users may find the documentation lacking in detail, leading to challenges in implementing complex monitoring setups without external assistance.
3. Splunk Observability Cloud
Best for Security-Focused Full-Stack Observability
Splunk Observability Cloud is an enterprise-grade observability platform combining infrastructure monitoring, APM, log management, RUM, and synthetic monitoring with deep integration into Splunk’s security and SIEM ecosystem.
Key Features
- Full-stack observability across infrastructure, APM, logs, RUM, and synthetics
- Real-time streaming metrics with sub-minute alerting via SignalFx
- Tight integration with Splunk SIEM and Enterprise Security for unified SecOps + DevOps visibility
- AI-driven anomaly detection and automated alert correlation
- OpenTelemetry-native instrumentation support
Pricing
- Infrastructure Monitoring From ~$95/host/month
- APM From ~$150–$175/host/month
- Enterprise (full-stack) $200+/host/month
- Free trial Available
Note: Splunk’s pricing scales with hosts, data ingestion, and retention. Large deployments should request a custom quote costs can vary significantly.
Pros
- Best-in-class log querying with SPL for deep investigative analysis
- Unified security + observability for SecOps and SRE teams working together
- Real-time streaming metrics with fast, reliable alerting
- OpenTelemetry support prevents vendor lock-in
Cons
- Steep learning curve for SPL and advanced configuration
- Full value requires multiple licensed add-ons
4. Dynatrace
Best AI-Powered Observability for Large Enterprises
Dynatrace is an AI-powered observability platform that provides automatic and intelligent monitoring for cloud-native environments. With its comprehensive suite of monitoring and analytics tools, Dynatrace enables organizations to gain deep insights into the performance and reliability of their systems and applications.
Key features
- Automatic detection and remediation to help remediate performance issues, ensuring the continuous optimization of cloud-native environments and enhancing user experience.
- Integrates with many cloud platforms and third-party tools, ensuring compatibility with diverse environments and workflows.
Pricing
- Full-stack monitoring: $0.08 per hour for an 8 GB host.
- Infrastructure monitoring: $0.04 per hour for any size host.
- Kubernetes monitoring: $0.002 per hour for any size pod.
- Application security: $0.018 per hour for an 8 GB host.
- Real User Monitoring: $0.00225 per session.
- Synthetic monitoring: $0.001 per synthetic request.
- Log management & analytics: $0.20 per GB.management and analytics.
Pros
- AI-driven root cause analysis automates detecting and resolving performance issues, reducing manual effort and enabling proactive problem-solving.
- Full-stack monitoring capabilities provide comprehensive visibility into the entire IT stack, from infrastructure to applications, enabling end-to-end performance management.
Cons
- Complex setup and configuration may require additional time and resources to implement effectively, potentially increasing the time to value for new users.
5. Grafana
Best Open-Source Observability Stack
Grafana is an open-source observability platform that offers flexible visualization and analytics capabilities for metrics, logs, and traces. With its LGTM stack, extensive plugin ecosystem, and customizable dashboard options, Grafana empowers users to create tailored monitoring solutions that suit their specific needs and preferences.
Key features
- Flexible visualization provides a wide range of visualization options, including charts, graphs, and dashboards, enabling users to create customized monitoring solutions.
- Supports a wide range of data sources and integrations, allowing users to collect and analyze data from diverse sources and technologies.
- Offers customizable dashboard options, allowing users to create personalized monitoring views that provide actionable insights at a glance.
Pricing
- Cloud Free: Free
- Cloud Pro: Pay-as-you-go
- Cloud Advanced: Custom pricing
Additional Pricing:
- Metrics: $0.005/1,000 metrics
- Logs: $0.10/GB
- Traces: $0.10/GB
- Grafana: $8/user/month (billed annually) or $10/user/month (billed monthly)
- Grafana with Enterprise plugins: $55/user/month (billed annually) or $66/user/month (billed monthly)
Pros
- Open-source and customizable platform allows flexibility and extensibility, empowering users to tailor the tool to their specific needs and preferences.
- Active community support and documentation resources provide valuable assistance and guidance for users, making it easier to get started and troubleshoot issues.
Cons
- While the platform offers extensive customization options, some users may find the learning curve steep, particularly for complex configurations or advanced features.
- As an open-source project, Grafana may lack some of the advanced capabilities and support options available with commercial observability platforms, potentially limiting its suitability for enterprise-scale deployments.
6. Honeycomb
Best for High-Cardinality Debugging
Honeycomb is a distributed observability platform that offers real-time monitoring and debugging for modern software applications. Its high-cardinality data exploration and dynamic sampling capabilities enable organizations to gain deep insights into the performance and behavior of their systems and applications.
Key features
- Captures unlimited custom attributes for dubbing with no impact on speed, allowing for faster and more accurate observability.
- Distributed tracing to help you consolidate logs and metrics into a single workflow.
- OpenTelemetry features to provide Otel SDKs for popular languages and start sending data directly to Honeycomb.
- AI-powered assistant to help you ask questions and generate answers to your queries.
Pricing
- Free : 20M Events Per Month (EPM).
- Pro: Starting at $100/month or $1,000/year.
- Enterprise: Starting at $24,000/year.
Pros
- High-cardinality data exploration capabilities enable users to analyze large volumes of data and uncover hidden insights.
- Real-time collaboration features facilitate efficient communication and problem-solving among team members.
- Distributed tracing provides end-to-end visibility into complex distributed systems, enabling users to identify and resolve performance issues quickly.
Cons
- Advanced features such as high-cardinality data exploration and dynamic sampling may require additional configuration and setup, potentially increasing implementation time and complexity.
- While the platform offers comprehensive monitoring capabilities, some organizations may find that additional customization or integration is necessary to meet their specific needs.
7. New Relic
Best for Full-Stack Visibility with Free Tier
New Relic is a full-stack observability tool that shows metrics, events, logs, and traces in a single platform. With its full-stack monitoring capabilities and extensive integrations, New Relic enables organizations to gain deep insights into the performance and reliability of their systems and applications.
Key features
- Comprehensive monitoring capabilities for the entire technology stack, including applications, infrastructure, and user experience.
- Powerful application performance monitoring capabilities that provide real-time insights into application performance, enabling proactive problem-solving and optimization.
- Infrastructure monitoring features that provide visibility into the health and performance of cloud and on-premises infrastructure, helping organizations ensure the reliability and scalability of their systems.
- Log management capabilities that enable organizations to centralize and analyze log data from diverse sources, facilitating troubleshooting and issue resolution.
Pricing
- Free: Offers 100 GB of free data ingest per month, unlimited basic users, and one free full-platform user.
- Standard: Pricing starts at $10 for the first full-platform user, with additional users costing $99 each. Data ingest beyond 100 GB costs $0.35/GB.
- Pro: Pricing starts at $349 per user (annual commitment) or $418.80 per user (monthly pay-as-you-go).
- Enterprise: Custom pricing for large-scale organizations with advanced security and support needs. This plan includes additional features like FedRAMP Moderate and HIPAA eligibility.
Additional Costs
- Data Ingest: Beyond the included 100 GB, data ingest costs $0.35/GB (original data option) or $0.55/GB (Data Plus option).
- Compute Capacity: Pricing varies based on computing capacity units (CCUs) consumed.
- Add-ons: Additional features like synthetic monitor checks, extended data retention, and Vulnerability Management are available for an extra cost.
Pros
- At-a-glance app health insights.
- Shows real-time user insights.
Cons
- Overwhelming user interface.
- Complex setup and configuration may require additional time and resources to implement effectively, potentially increasing the time to value for new users.
- Lacks customer support.
8. IBM Instana
Best for Automatic Discovery in Complex Environments
IBM Instana is a real-time full-stack observability solution that provides organizations with end-to-end infrastructure monitoring to help prevent and remediate any issues. The tool goes beyond traditional APM solutions by enabling observability across processes such as DevOps, SRE, platform engineering, ITOps, and development.
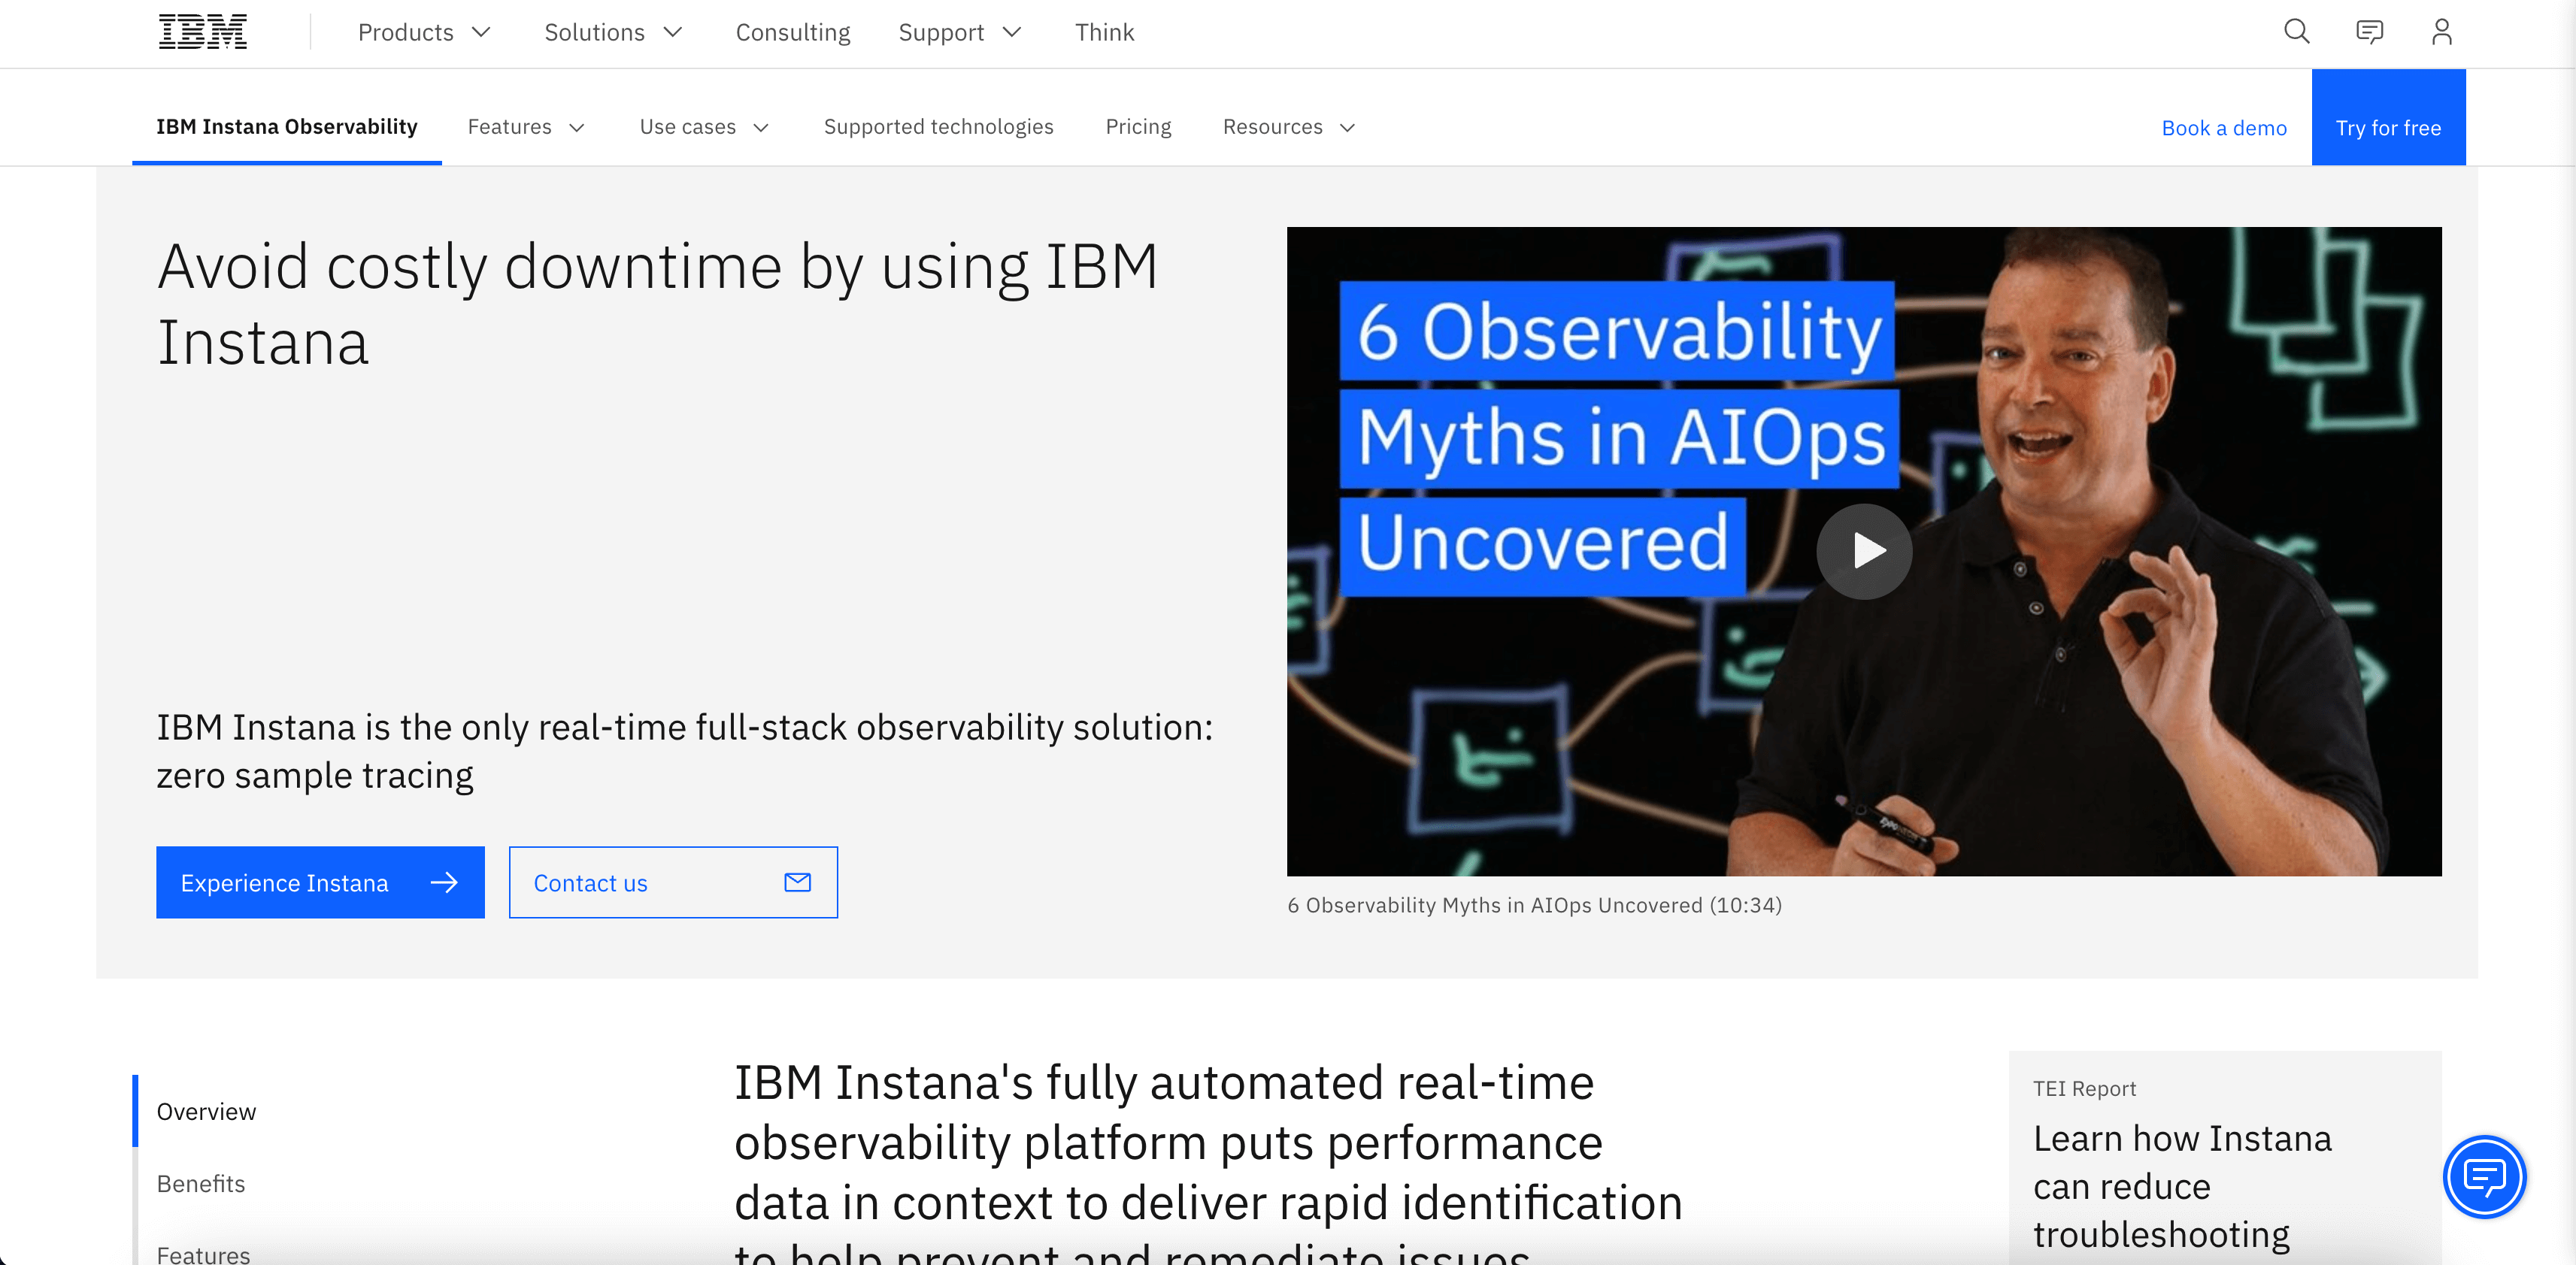
With its automatic discovery and monitoring of microservices, distributed tracing, and AI-driven root cause analysis, Instana empowers organizations to gain deep insights into the performance and behavior of their systems and applications.
Key features
- Full-stack observability helps organizations continuously monitor application performance, Kubernetes, databases, microservices, APIs, and containers in real-time with no sampling.
- Automation and intelligence to automatically discover and map services, ingest observability metrics, and trace requests and profiles.
- Integrations with 300+ tools to provide a comprehensive view of application performance across IT infrastructure.
Pricing
- Observability Essentials: $75 per month per host
- Observability Standard: $175 per month per host
- Observability Enterprise: Custom pricing for large enterprises.
Pros
- Distributed tracing enables organizations to trace requests across distributed systems, identify performance bottlenecks, and optimize resource usage.
- AI-driven root cause analysis automates detecting and resolving performance issues, reducing manual effort and enabling proactive problem-solving.
Cons
- Complex setup and configuration may require additional time and resources to implement effectively, potentially increasing the time to value for new users.
9. Zipkin
Best Lightweight Option for Tracing-Focused Teams
For companies that are just discovering the need for an observability solution, Zipkin can be a great option. This open-source distributed tracking system provides insights into latency problems in microservices architectures.
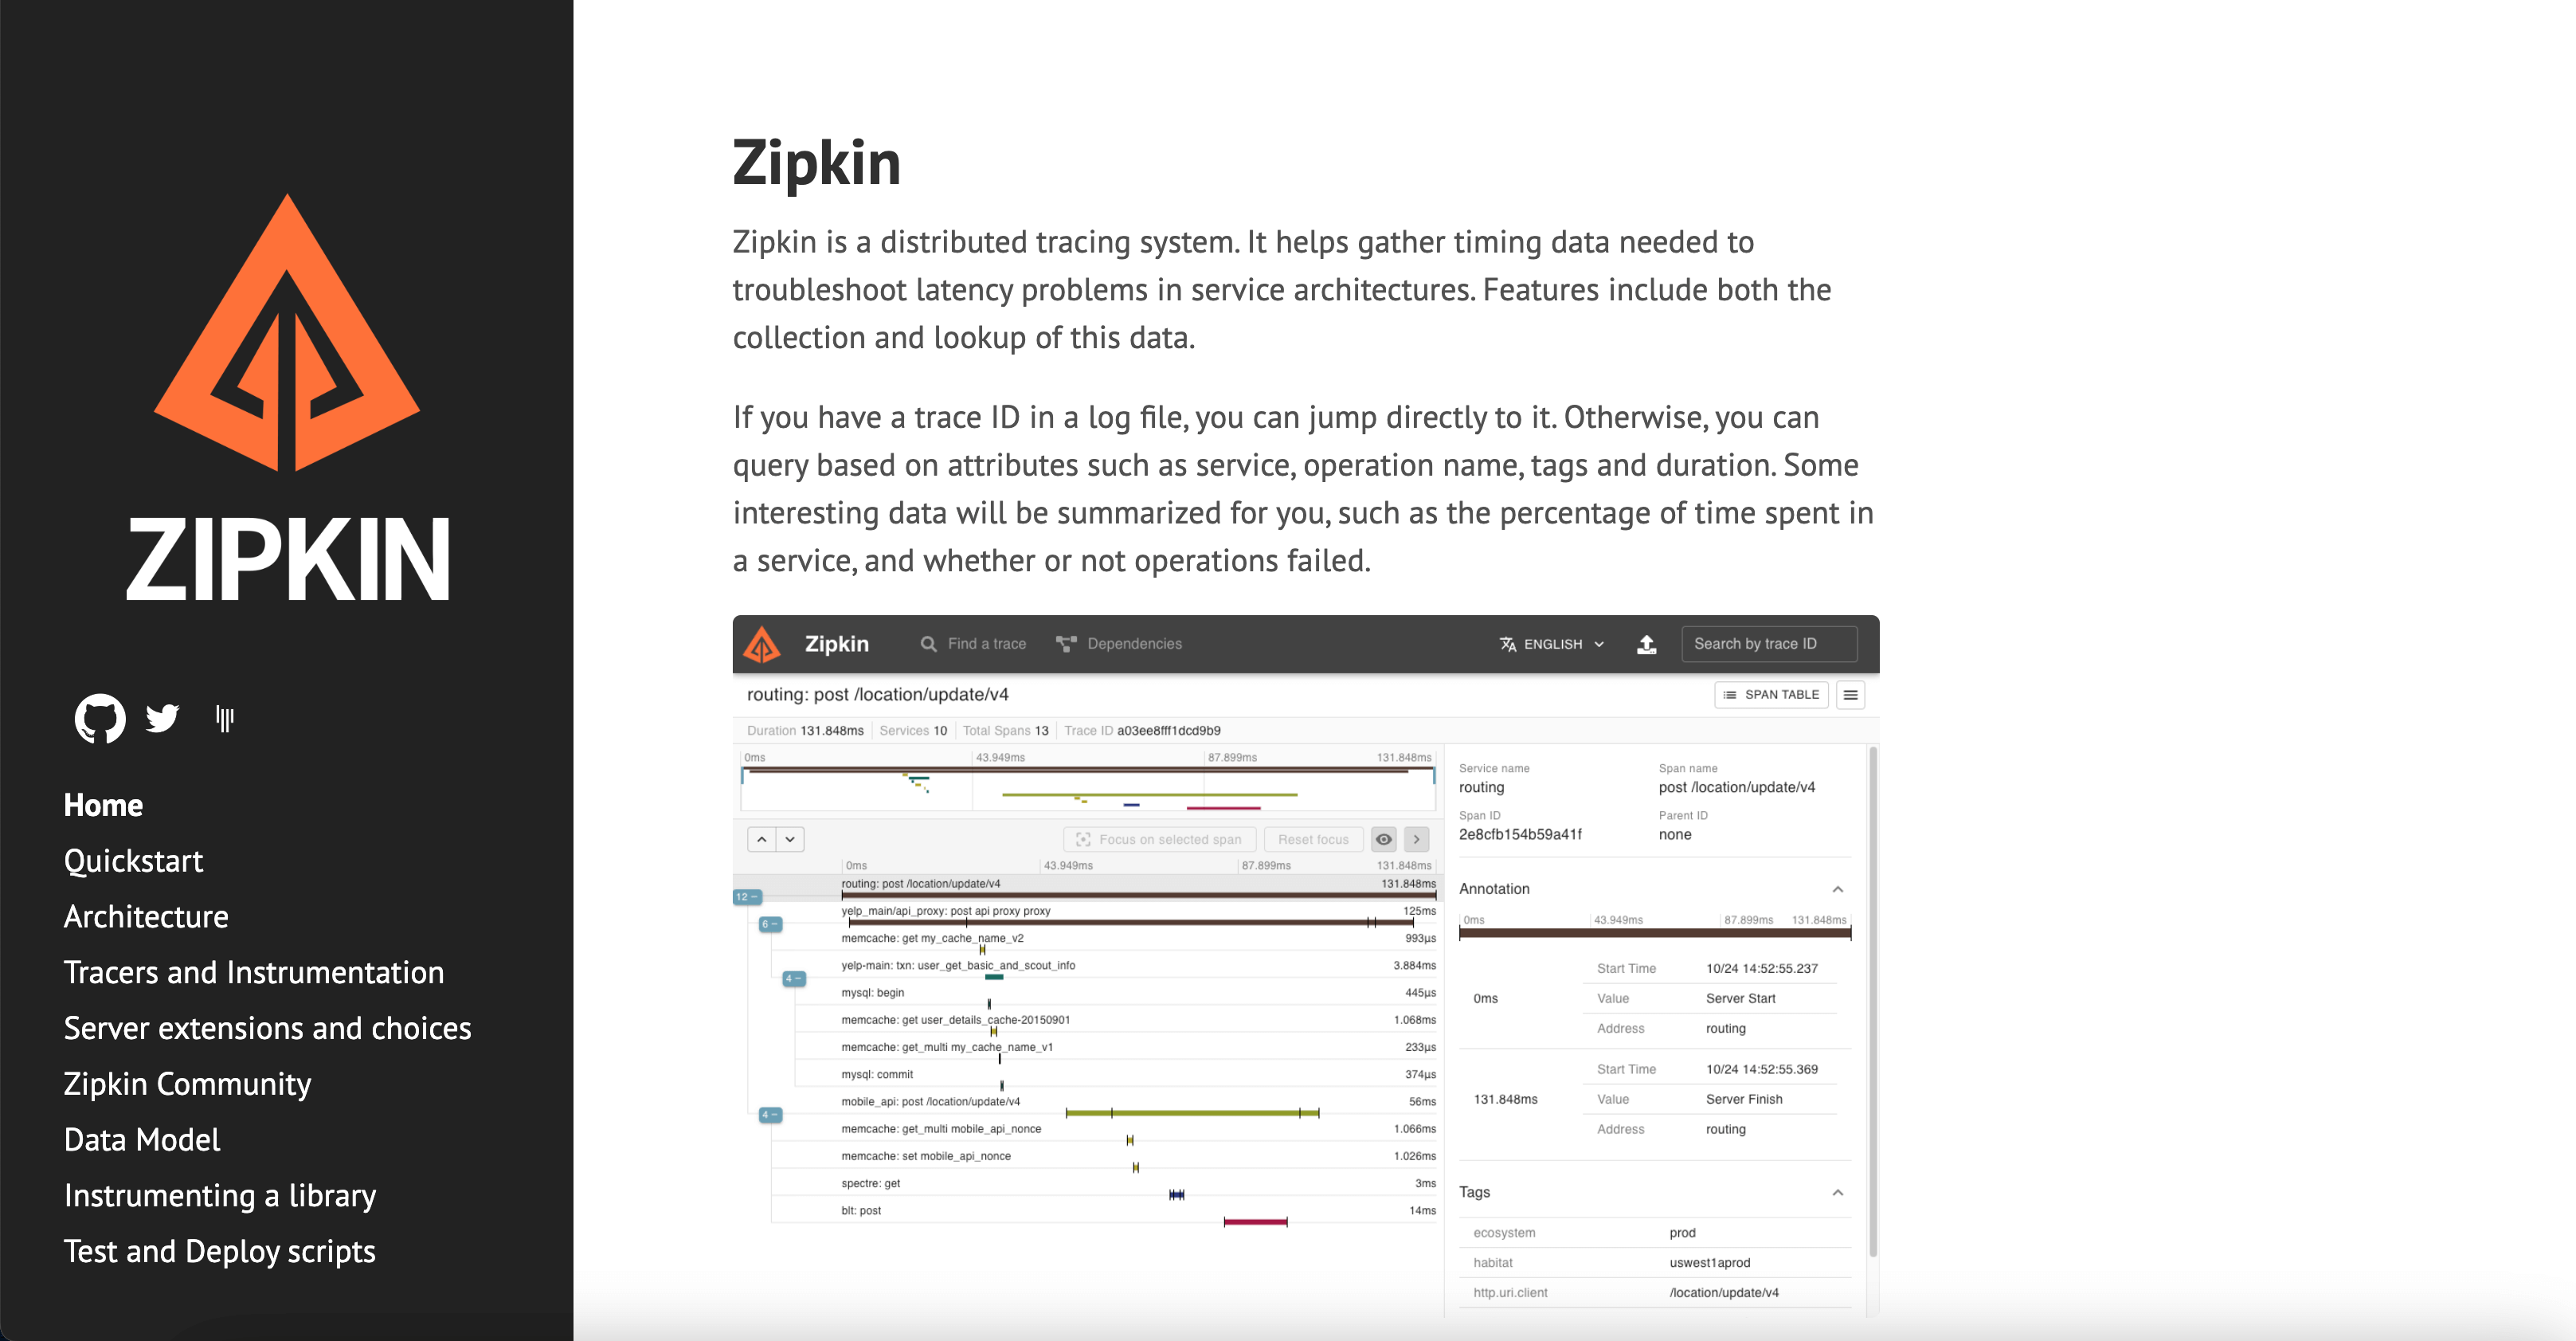
With its distributed tracing capabilities, dependency visualization, and extensive language and framework support, Zipkin enables organizations to gain deep insights into the behavior and performance of their systems and applications.
Key features
- Offers distributed tracing capabilities that enable organizations to trace requests across distributed systems, identify performance bottlenecks, and troubleshoot latency issues.
- Supports a wide range of programming languages and frameworks.
- Provides dependency visualization features that allow users to visualize the relationships between different components in their microservices architectures, enabling them to understand the flow of requests and responses.
Pricing
- Open-source.
Pros
- Extensive language and framework support ensures compatibility with diverse technology stacks and environments, enabling organizations to leverage Zipkin in a wide range of use cases.
- Open-source and customizable nature of Zipkin allows users to tailor the platform to their specific needs and preferences, contributing to its ongoing development and improvement.
Cons
- While Zipkin offers powerful tracing capabilities, some users may find that additional features such as log management and metrics monitoring are not available out-of-the-box, requiring integration with additional tools or platforms.
- As an open-source project, Zipkin may lack some of the advanced capabilities and support options available with commercial observability platforms, potentially limiting its suitability for enterprise-scale deployments.
- While Zipkin is highly customizable, organizations with specific compliance or security requirements may need to invest additional effort in ensuring that their deployments meet regulatory standards.
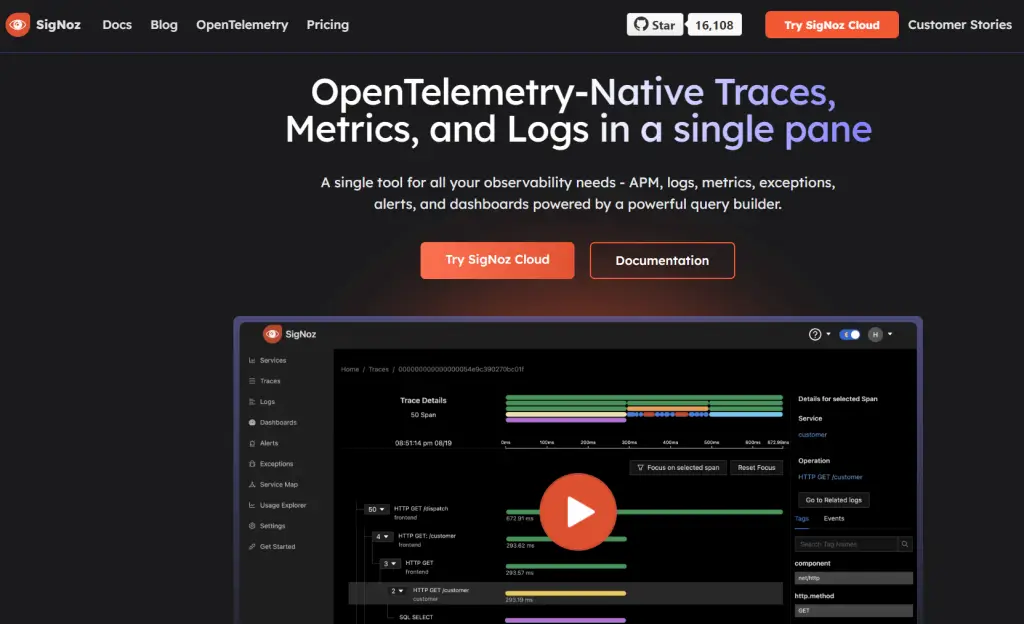
10. SigNoz
Best OpenTelemetry-Native Open-Source Platform
SigNoz is an observability tool that uses OpenTelemetry-Native traces, metrics, and logs to help users monitor applications and troubleshoot issues. The tools consolidate data from multiple sources to help you debug issues faster.
Key features
- Offers a unified platform for monitoring metrics, logs, and traces.
- Consolidates data from diverse sources into a single interface for seamless analysis and diagnostics.
- Real-time data application performance monitoring with database and external call tracking.
- Intelligent alerting capabilities allow users to set up customizable alerts for key performance indicators and threshold breaches, ensuring proactive monitoring and timely issue resolution.
Pricing
Hosted on SigNoz cloud:
- Teams: Starts $199 per month.
- Enterprise Cloud: custom pricing.
Hosted in your infra:
- Community Edition: free to self-host.
- Enterprise Edition: custom pricing for scale (starts at $2500 per month).
Pros
- Streamlined installation and setup process.
- AI-driven anomaly detection for proactive issue mitigation.
- Extensive customization options for dashboards and alerts tailored to specific use cases.
Cons
- Learning curve associated with mastering advanced features and configuration settings.
- Potential affordability challenges for small to medium-sized organizations with limited budgets.
Quick Comparison: Top Observability Tools at a Glance
| Tool | Best For | Free Tier | Pricing Model | AI Features |
|---|---|---|---|---|
| Middleware | Full-stack, flexible teams | 14-day trial | Pay-per-GB | ✅ OpsAI — detects, RCAs & auto-fixes with PRs |
| Splunk | Security + observability together | Free trial | Per host/month | ✅ SignalFx anomaly detection |
| Datadog | Enterprise cloud monitoring | 5 hosts | Per host | ✅ Watchdog ML |
| Dynatrace | AI-automated large environments | Trial only | Per host/hour | ✅ Davis AI |
| Grafana | Open-source customization | Cloud free tier | Per GB | ⚠️ Plugin-based |
| New Relic | Full-stack + generous free tier | 100 GB/month | Per user + per GB | ✅ Lookout AI |
| Honeycomb | High-cardinality debugging | 20M events/month | Per event | ✅ Query assistant |
| SigNoz | OpenTelemetry-native OSS | Self-hosted free | Per GB (cloud) | ⚠️ Limited |
| Zipkin | Lightweight distributed tracing | Free (OSS) | Free | ❌ |
How to Choose the Right Observability Tool
Use this framework to narrow down your options:
1. Define Your Stack Coverage Needs
Do you need APM only? Infrastructure + logs? Full-stack including RUM and synthetics? Tools like Middleware and Datadog cover everything; Zipkin covers tracing only.
2. Assess Your Scale
Small teams and startups benefit most from flexible pricing (Middleware, New Relic free tier, Grafana Cloud). Enterprise-scale deployments warrant Dynatrace or Datadog despite the cost.
3. Evaluate Integration Depth
Check whether the tool natively integrates with your existing stack — your cloud provider, CI/CD pipeline, alerting channels, and incident management tools.
4. Factor in AI and Automation
Manual alert triage is a tax on your engineering team. Tools with AI-driven anomaly detection (Middleware OpsAI, Dynatrace Davis, Datadog Watchdog) reduce noise and speed up root cause identification.
5. Always Use the Free Trial
Every tool on this list offers a free tier or trial. The real-world experience of ingesting your own data and navigating your own dashboards will tell you more than any comparison guide.
Final Recommendation
The best observability tool for your team is the one that matches your scale, stack, and budget not the one with the longest feature list.
- For teams that want full-stack observability without overpaying: Middleware is the strongest choice in 2026. Its modular architecture, usage-based pricing, and OpsAI capabilities make it practical at every stage of growth.
- For large enterprises with complex multi-cloud environments: Datadog or Dynatrace offer unmatched depth and breadth.
- For budget-conscious teams comfortable with self-hosting: Grafana + SigNoz provide a complete open-source stack.
Whatever you choose, use the free trial. Real data in a real environment is the only honest benchmark.
Try Middleware free for 14 days → | Book a personalized demo →
FAQs
Which observability tool is best for Kubernetes?
Dynatrace, Datadog, and Middleware all have strong Kubernetes support with automatic pod discovery and namespace-level visibility. Middleware is particularly cost-effective for Kubernetes-heavy teams.
What is the best open-source observability tool in 2026?
Grafana (LGTM stack) and SigNoz are the strongest open-source options. SigNoz is better for teams that want OpenTelemetry natively; Grafana is better for teams that need maximum flexibility and integration breadth.
What is alert fatigue and how do observability tools help?
Alert fatigue happens when engineers receive too many alerts many redundant or low-priority and begin ignoring them. AI-powered observability platforms like Middleware (OpsAI), Dynatrace (Davis AI), and Datadog (Watchdog) correlate alerts, suppress duplicates, and surface only actionable signals.
Can Middleware ingest alerts from Datadog and Grafana?
Yes. Middleware’s OpsAI supports third-party alert ingestion from Datadog, Grafana, and other sources, allowing teams to consolidate alert management without ripping out existing tooling.