


Datadog pricing is the per-product, per-dimension billing model that charges separately for hosts, APM spans, log ingestion, log indexing, custom metrics, and RUM sessions. On paper, it looks reasonable $15/host/month for infrastructure isn’t a headline number. In practice, high-water-mark billing, cardinality taxes, and dual-charged logs mean the invoice rarely resembles the pricing page by month twelve. Here’s exactly where each meter breaks, and what it costs to fix.
Key takeaways
- Every Datadog product is billed and can break the budget independently. Infrastructure, APM, logs, custom metrics, RUM, and Kubernetes each have their own meter and their own way of multiplying, a cost problem in one doesn’t offset savings in another.
- A single traffic spike can cost a full month. Because Datadog bills hosts at peak hourly count, a 5-day autoscaling surge gets billed as if it ran for 30 days.
- RUM cost scales with product success, not infrastructure and the bill grows fastest exactly when a launch or marketing push is working.
- One Kubernetes misconfiguration can multiply the entire invoice. Deploying Datadog’s agent per container instead of per node bills every pod as its own separate host.
- Middleware consolidates all six of these meters into one usage-based rate, full-stack observability (infrastructure, APM, logs, RUM, Kubernetes) on a single, OpenTelemetry-native platform, without forced bundling or a cardinality tax.
The mechanics that make this expensive:
- High-water-mark billing on hosts Datadog bills your entire month at your peak hourly host count, not your average.
- Custom metric cardinality tax every unique tag combination is a separate billable metric; OpenTelemetry metrics are billed as “custom” with no exception.
- Logs billed twice you pay to ingest, then pay again (at a much higher per-event rate) to make them searchable.
Most teams respond by indexing a fraction of their logs and sampling traces aggressively, cutting cost by cutting visibility, not by cutting waste.
APM, Logs, RUM: Where Each One Quietly Breaks the Budget
Every function of Datadog follows the same arc. It starts small and useful. Nobody watches the meter behind it. Then, months later, someone finally does and the story is always some version of the same one.
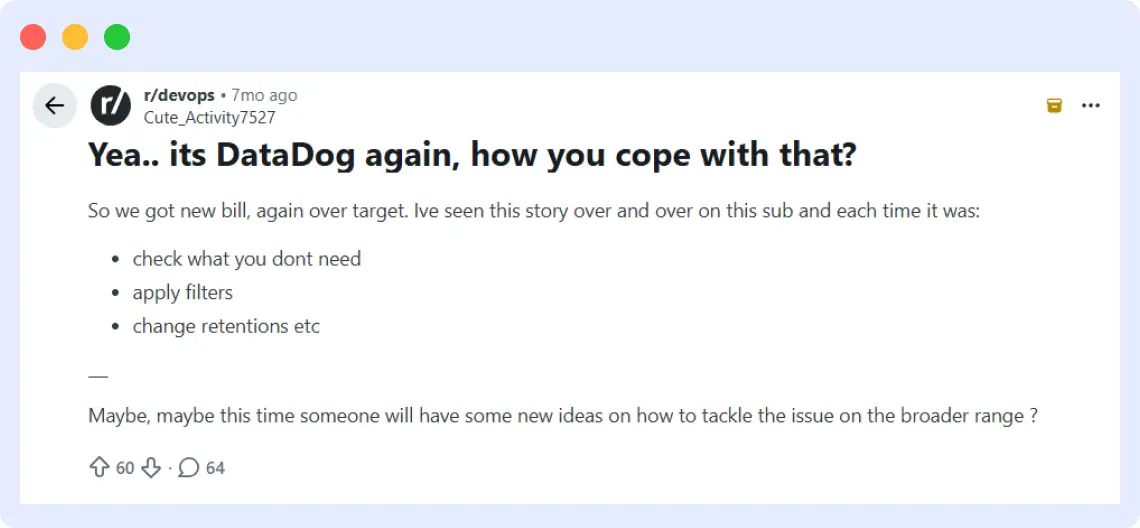
How on earth do people deal with Datadog’s billing practices?
byu/ycnz insysadmin
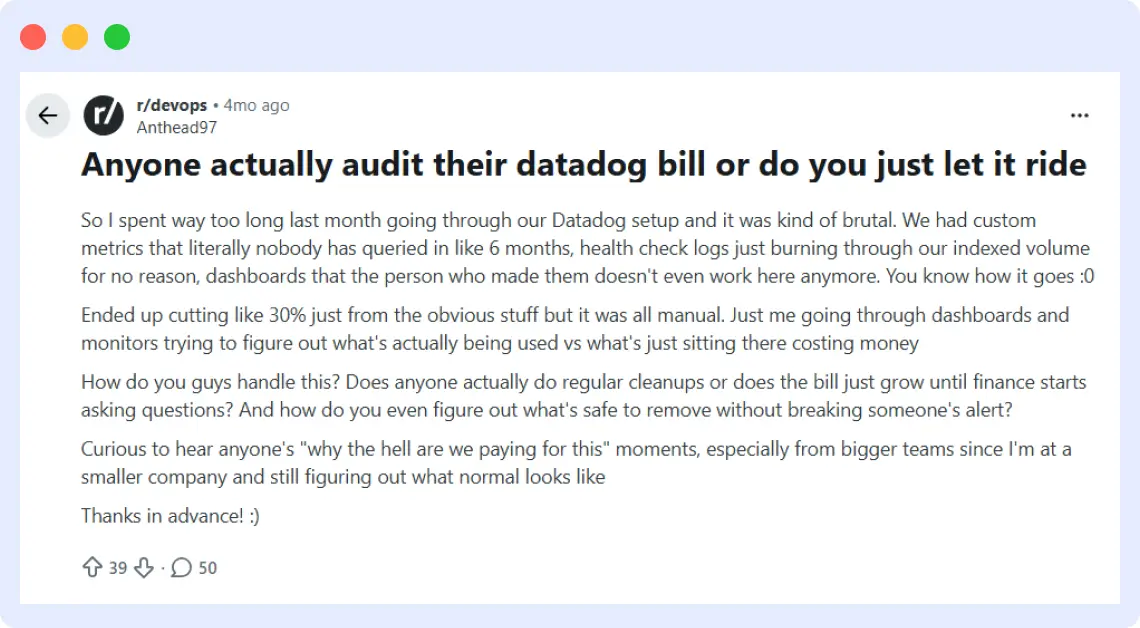
“If your Datadog bill is spiraling or you’re exploring alternatives, this side-by-side comparison will help you make an informed decision for 2026.”
Infrastructure
This is where Datadog’s billing starts, and it starts looking harmless. $15 a host a month, annual billing not the kind of number that ends up in a boardroom. Then Kubernetes autoscaling kicks in for a launch or a traffic spike, and Datadog counts hosts every hour, drops the top 1%, and bills the entire month at the next-highest hour it saw.
A five-day surge quietly becomes a thirty-day charge on the Datadog invoice. Nobody decided to pay for a month at peak capacity. Datadog’s billing model decided for them.
APM
This is where the number triples without anyone changing anything. Datadog’s APM pricing $31 a host a month covers the base product not the indexed spans, and a single busy microservice can burn through its Datadog span allotment in days.
Multiply that across thirty or forty services and the overage line grows past the base fee sitting under it. There’s also a catch most teams miss on the way in: Datadog doesn’t let you buy APM without also paying for Infrastructure Monitoring on the same hosts. It’s not a bundle but it’s a requirement.
Logs
Datadog’s two-part pricing model does the most damage here. Ingestion is cheap, ten cents a gigabyte, which is exactly what makes it feel safe to send everything to Datadog. Indexing the part that actually makes logs searchable costs enough that most teams quietly index a fraction of what they send.
Nobody notices the gap until 2 a.m., mid-incident, when the log they need turns out to be one Datadog never indexed. The savings decision and the visibility failure are the same decision, made months apart by two different people with respect to Datadog logs pricing.
💡 Expert Tip: “Before ingesting logs into Datadog, set volume caps or filters teams often underestimate how quickly log storage costs grow.”
Custom metrics
This is the Datadog line item that blindsides teams who thought they’d done everything right. A metric with a handful of tags region, tier, environment looks harmless enough. Add one tag with real cardinality, a customer ID, a session token, and Datadog turns that single metric into thousands of billed metrics overnight.
Nobody added a new metric. Nobody touched the code. The Datadog bill multiplied because of a debugging tag someone added six months ago and forgot to remove. OpenTelemetry gets no exception as every OTel metric lands in Datadog’s “custom” bucket, taxed the same way.
RUM
RUM is the strange one on Datadog, because it’s not infrastructure driving the cost. It’s a success. Sessions scale with users, and users scale with a product launch or a marketing push working exactly as intended. The Datadog RUM pricing climbs precisely when the business is winning one of the only cost centers where growth itself is the thing you’re being billed for.
Kubernetes and containers
One misconfiguration here becomes the largest line item nobody planned for. Datadog expects one agent per node. Deploy it per container instead, an easy mistake in a dense cluster, and Datadog bills every pod as its own separate host. Ten pods on a node isn’t ten times the visibility. It’s ten times the Datadog invoice, for the exact same infrastructure.
Each of these, on its own, is a footnote in Datadog’s pricing docs. Stacked together, they’re the reason the number on Datadog’s pricing page and the number on the invoice stop resembling each other by the time a team is a year in.
| Function | Datadog list price | Where it actually breaks |
| Infrastructure | $15/host/month (annual) | High-water-mark billing a 5-day traffic spike gets billed as a full month at peak |
| APM | $31/host/month | Requires Infrastructure Monitoring on the same hosts; span overages stack on top of the base fee |
| Logs | $0.10/GB ingest & $1.70/million events indexed | You pay to collect, then pay again at a much higher rate just to make logs searchable |
| Custom metrics | $5 per 100/month over allotment | Billed by cardinality, not usefulness one high-cardinality tag can 10x the metric count overnight |
| RUM | $1.50 per 1,000 sessions | Scales with traffic, not infrastructure the bill grows exactly when the product is succeeding |
| Kubernetes/containers | 5 free containers per host (Pro) | One agent misconfiguration bills every pod as its own host, 10 pods per node can mean 10x the invoice |
Reduce observability costs with full-stack observability using Middleware!
Look at that table again, and a pattern sits underneath the six rows: every function is billed as if it were a separate product, because on Datadog, it is. Infrastructure, APM, logs, custom metrics, RUM, and Kubernetes each have their own meter, their own overage rules, and their own way of quietly multiplying. Managing that isn’t a monitoring problem anymore, it’s a reconciliation problem, and it usually lands on whoever owns the invoice at the end of the month.
Middleware takes a different starting position: full-stack observability infrastructure, APM, logs, RUM, and Kubernetes in one platform, on one bill, without the sprawl of stitching several tools together to get the same coverage. A few ways that plays out against the specific traps above:
| Function | The Datadog trap | How Middleware handles it |
| Infrastructure | High-water-mark billing taxes short spikes for the whole month | Usage-based pricing on actual data sent no peak-hour penalty |
| APM | Indexed span overages, plus a forced Infrastructure Monitoring purchase | Included in the same platform, no separate bundling requirement |
| Logs | Ingest cheap, index expensive most teams can’t afford full visibility | Single usage-based rate across logs, metrics, and traces no separate indexing tax |
| Custom metrics | Cardinality tax; OpenTelemetry metrics billed as “custom” | OpenTelemetry-native by design no custom-metric penalty tier |
| RUM | Bill scales with product success | Included in the same platform-wide rate, not a separate meter |
| Kubernetes/containers | Agent misconfiguration can 10x the bill | One unified OTel agent across the stack, not per-product agents to misconfigure |
The bigger point isn’t just that Middleware is cheaper on any one row it’s that there’s only one row to manage. No stitching together six tools with six query languages to answer one incident question. No forecasting exercise across a dozen independent meters. One platform, one pricing model, one place to look when something breaks.
Middleware gives you full-stack observability infrastructure, logs, APM, RUM, and Kubernetes in one platform, with pricing you can actually predict.
Read about Datadog alternatives
Why teams switch
- One bill, not six – A single usage-based rate instead of separately metered products across hosts, logs, metrics, traces, and sessions.
- BYOC deployment – Keep data in your VPC, cut egress costs, and clear stricter security reviews.
- Clean UX – Easier navigation and smooth flows across the product.
- No forced bundling – Get APM without being required to buy infrastructure monitoring on top of it.
- No hidden costs – Pay for what you use at a very transparent price.
- Built-in AI SRE agent – OpsAI correlates root causes across your full stack and can open a pull request with the fix, not just an alert.
- One agent, one setup – A single OpenTelemetry-native agent instead of separate agents per product.
- Enterprise-ready – SOC 2 Type II, ISO 27001, HIPAA, and GDPR compliant.
Still deciding? Here’s the honest version.
“We’re already deep into Datadog. Is switching worth the migration effort?”
If you’re on 2–3 Datadog products and the bill still surprises you every quarter, most teams recoup the migration effort within a couple of billing cycles. If you’re using Datadog’s deepest security/SIEM tooling and it’s mission-critical, that’s the one case worth pressure-testing first. Middleware isn’t there yet.
“Will we lose visibility moving off Datadog?”
No infra, logs, APM, RUM, and Kubernetes monitoring are covered natively, not bolted on. What you gain is a single pane instead of five.
“What if our usage doesn’t shrink, just the bill structure changes?”
That’s the point. You’re not being asked to monitor less, you’re being asked to stop paying a premium to monitor the same things across a dozen separate meters.
Teams using Middleware have reported up to 60-70% reduction in storage and ingestion costs simply by filtering unnecessary metrics early – Read about Why businesses are migrating to Middleware
Datadog Pricing in Practice: How MindOrigin Cut Observability Costs 75% After Switching
MindOrigin, a FinTech platform provider for stockbrokers and banks, is a real example of this trade-off playing out. Before Middleware, the team evaluated Datadog, New Relic, and SigNoz to solve a specific problem: correlating logs, traces, and metrics while meeting a regulatory requirement to retain six years of trading logs. Datadog worked technically, but the pricing didn’t scale with them the way they needed it to.
“Tools like Datadog, although effective, came with prohibitive costs that escalated as our infrastructure grew.”
Krishna Charan BS, Information Security Head, MindOrigin
After switching to Middleware, the results were concrete:
- 75% reduction in observability costs
- 50% faster Mean Time to Resolution (MTTR)
- 75% reduction in root cause analysis time
- 25% improvement in resource utilization
Read the case study about MindOrigin
Wrapping up
Datadog earns its reputation the hard way with genuinely deep features, from APM to cloud SIEM to digital experience monitoring, all in one place. For teams that need that full breadth and have the bandwidth to actively manage it, that’s a real trade worth making.
The catch is what happens on the way out: dashboards, monitors, and years of alert tuning get woven so deeply into Datadog’s ecosystem that leaving costs almost as much engineering time as the pricing model did in the first place.
That’s the actual decision in front of most teams not “is Datadog good,” but “is staying worth the compounding cost of staying.” If the answer keeps trending toward no, Middleware is built for exactly that exit: full-stack observability on open standards, with pricing simple enough to forecast instead of audit.
Because it’s OpenTelemetry-native rather than proprietary, moving your instrumentation over is a far smaller lift than switching between two closed ecosystems usually is. The 14-day trial comes with unlimited data and no card required enough room to put your actual numbers next to your current Datadog invoice and see which one holds up.
FAQs
What is the highest hidden cost in Datadog?
For many organizations, log management is one of the largest contributors to observability spend due to high ingestion volumes and retention requirements.
Can I reduce Datadog costs?
Yes. Common optimization strategies include reducing unnecessary logs, optimizing trace sampling, managing metric cardinality, and reviewing retention policies.
Is Datadog suitable for startups?
It can be, especially for teams that need advanced observability. However, startups with tighter budgets may also evaluate platforms that provide broader capabilities with simpler pricing.
Is Middleware cheaper than Datadog?
Pricing depends on your deployment size and telemetry usage. However, Middleware’s unified platform and simplified pricing model can make total costs more predictable for teams using multiple observability features.