
Summary: We ran seven identical prompts through Middleware OpsAI and Resolve AI, covering use cases across Grafana, Datadog, APM, RUM, and Kubernetes. OpsAI won six out of seven rounds most often by a 6× to 10× margin and delivered actionable output like runbooks, kubectl commands, and ready-to-merge pull requests. Resolve AI performed well in isolated cases but struggled with delayed responses, inaccurate metric readings, and heavy dependence on repeated user inputs.
The core reason behind the gap: OpsAI is built on Middleware’s own full-stack observability platform, while Resolve AI depends on third-party observability data providers.
Benchmark at a glance
| # | Use Case | OpsAI Time | Resolve AI Time | Winner |
| 1 | Grafana pod/instance discovery | < 1 min | > 10 min (failed) | OpsAI |
| 2 | Instance health investigation | < 1 min | > 8 min | OpsAI |
| 3 | Datadog pods with CPU/memory | ~ 5 min | > 30 min (inaccurate) | OpsAI |
| 4 | CPU threshold alert RCA | ~ 2 min | > 18 min | OpsAI |
| 5 | Application crash RCA | ~ 1.5 min | ~ 12 min | OpsAI |
| 6 | PSP payload parse error | ~ 2 min | ~ 1 min | Tie* |
| 7 | K8s container restart alert | ~ 3 min | ~ 14 min | OpsAI |
*On use case 6, Resolve AI delivered the RCA one minute faster, but OpsAI was the only tool that generated a ready-to-merge pull request, so we call it a draw on the outcome.
Introduction
As engineering organizations scale, the pressure to detect, analyze, and resolve production issues fast has never been higher. Observability dashboards alone are no longer enough; engineering teams now expect AI-native platforms that can understand telemetry data, find root causes, and propose or apply fixes on their own. This is where agentic observability and SRE agents come in.
Middleware OpsAI and Resolve AI, both platforms, have emerged in this space. They promise to accelerate incident response and resolutions, but their architectures, data sources, and output quality differ significantly. To understand how they actually behave in production-like scenarios, we put both through a seven-round head-to-head comparison using various use cases and identical prompts across APM, RUM, and Kubernetes, including Grafana and Datadog data fetching.
In this blog, we walk through each round, comparing various metrics, response times, verdicts, and screenshots from the actual runs, and explain why architectural differences lead to such different outcomes. If you’re evaluating AI SRE agents or deciding between Middleware OpsAI, Resolve AI, or alternatives like Datadog’s Bits AI, this comparison should help you make a more informed decision.
What is OpsAI?
OpsAI is Middleware’s AI-native SRE agent, built directly on top of its full-stack observability platform. It’s designed to auto-detect issues, understand their root cause, and deliver actionable fixes. It didn’t stop here; it even goes beyond fixing and merging pull requests across every observability layer your application runs on.
Because OpsAI lives inside Middleware’s own observability stack, it has native, first-party access to:
- Kubernetes telemetry: pod state, container restarts, node health, cluster events
- APM: distributed traces, service dependencies, database queries, code-level profiling
- RUM: frontend errors, crashes, Core Web Vitals, session replays
- Logs and alerts: application logs, infrastructure logs, correlated error events
- Third-party integrations: Grafana and Datadog connectors for teams with existing stacks
What sets OpsAI apart is the combination of telemetry ownership and code awareness. Once you connect your GitHub account, OpsAI matches stack traces to exact files and lines, investigates historical context, and opens a pull request with the proposed fix. This end-to-end loop from detection through root cause to merged code is what the benchmark below tests.
What is Resolve AI?
Resolve AI is an SRE-focused agent that connects to existing observability and monitoring tools to help engineers investigate and remediate production incidents. Unlike OpsAI, Resolve AI doesn’t include its own observability backend; instead, it relies on third-party data providers such as Datadog, Grafana, PagerDuty, and similar platforms to pull the telemetry it needs.
That architectural choice has important consequences:
- Resolve AI is only as fast as the APIs of the tools it queries, and only as accurate as the data those tools expose.
- Context-gathering happens across multiple vendor APIs instead of a unified data layer.
- Deep correlations between metrics, traces, logs, and code changes require external integrations that may or may not be fully wired up.
In the benchmark below, this shows up repeatedly — especially in queries that require fetching structured data (like pod lists or CPU readings) or correlating signals across multiple telemetry streams.
Why this comparison matters (and where Datadog Bits AI fits in)
Middleware OpsAI isn’t just competing with Resolve AI. It’s also a direct alternative to Datadog‘s Bits AI, an agentic layer that sits on top of its observability stack. Bits AI and OpsAI share the same architectural philosophy: owning the observability platform gives the AI agent a deeper, cleaner context, which translates into faster and more accurate investigations.
Wherein Resolve AI takes a different approach, a platform-agnostic SRE agent that sits above your existing tools. That has its appeal, especially for teams that don’t want to switch vendors. But as the benchmark shows, the tradeoffs in speed, accuracy, and remediation depth are real.
1. Fetching Pods/Instances from Grafana
INFRASTRUCTURE DISCOVERY · GRAFANA
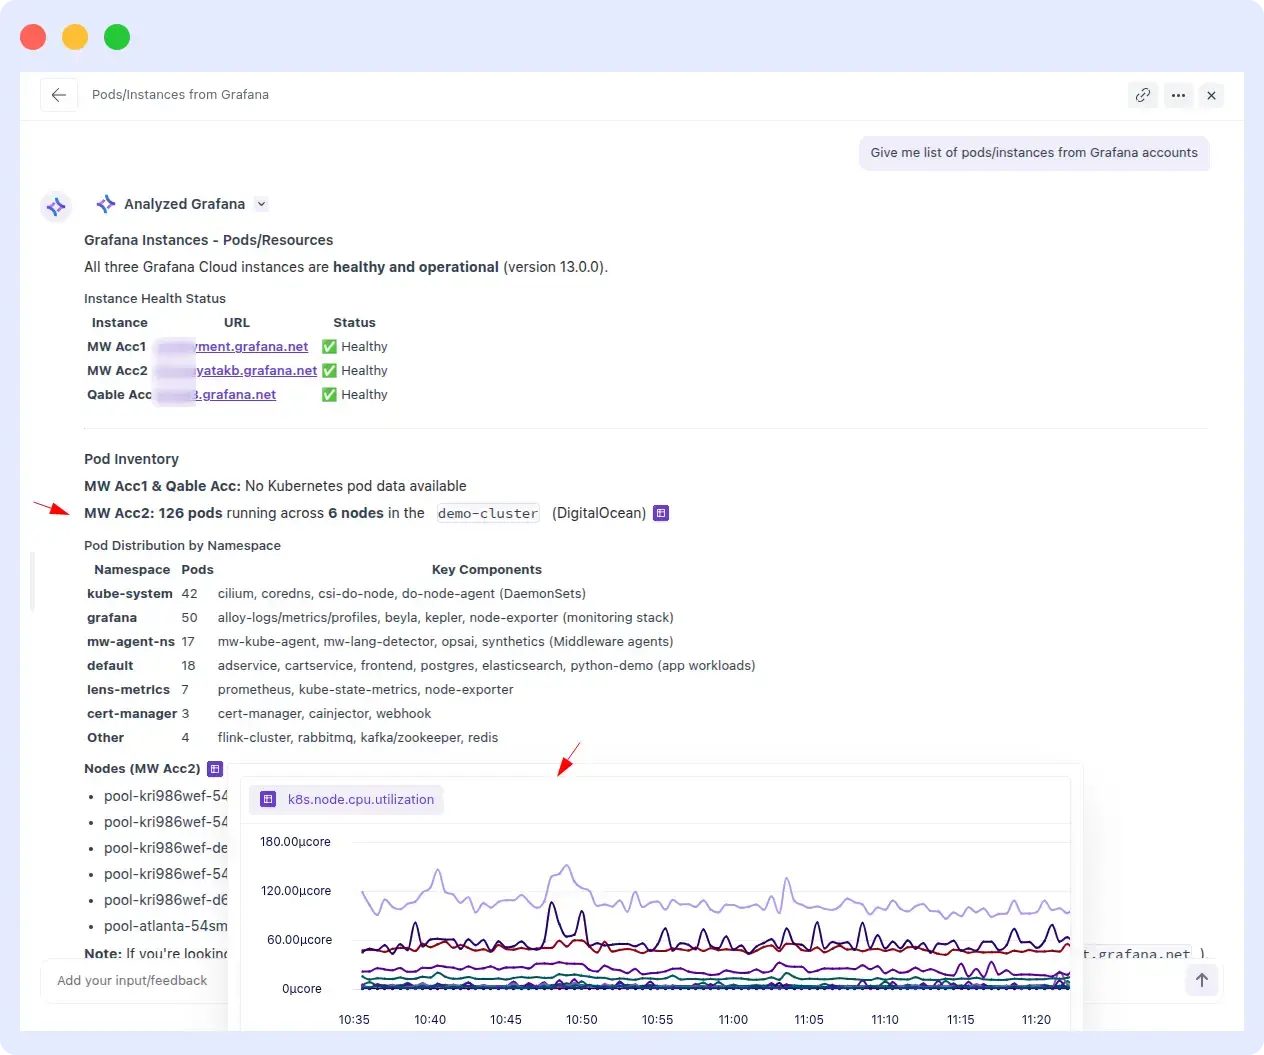
Prompt: “Give me a list of pods/instances from Grafana accounts.”
| OpsAI | Resolve AI |
| < 1 min | > 10 min (failed) |
What happened
OpsAI:
OpsAI successfully retrieved the correct list of pods and instances from the connected Grafana account in under a minute. The query was handled on the first attempt with no reprompts and no additional inputs required.
Resolve AI:
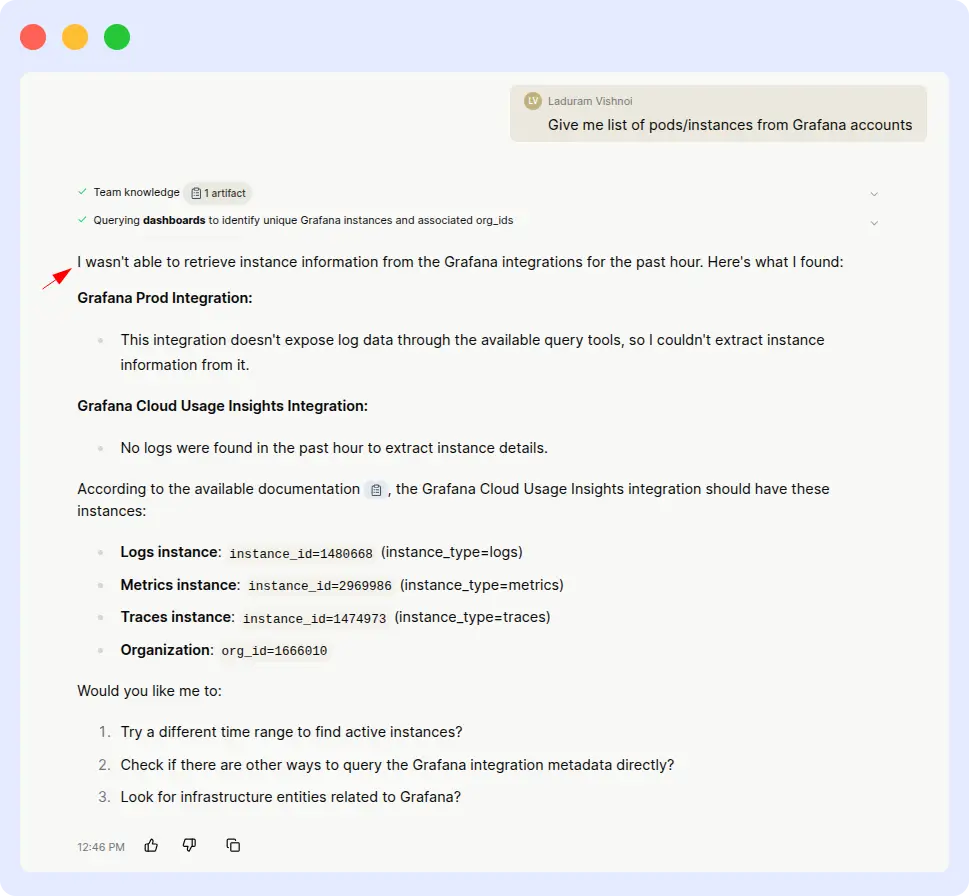
Resolve AI failed to return any results despite having an active Grafana integration with available pod data. After 10+ minutes of processing, the query came back empty, no pod list, no error explanation, just no output.
Comparison metrics
| Metric | OpsAI | Resolve AI |
| Response time | < 1 minute | > 10 minutes |
| Accuracy | Correct list | Empty output |
| Reprompts needed | 0 | N/A (never completed) |
| Winner | OpsAI | — |
Evidence
OpsAI Result:
Resolve AI result:
Verdict
OpsAI wins decisively.
OpsAI completed the task in a minute, while Resolve AI couldn’t complete it at all. When a user asks for a list of pods from a connected account, that task shouldn’t require heroics; it’s a discovery query. The gap here shows the real-world cost of relying on third-party APIs for core observability data versus owning the integration natively.
2. Instance Health Investigation
HEALTH INVESTIGATION · GRAFANA
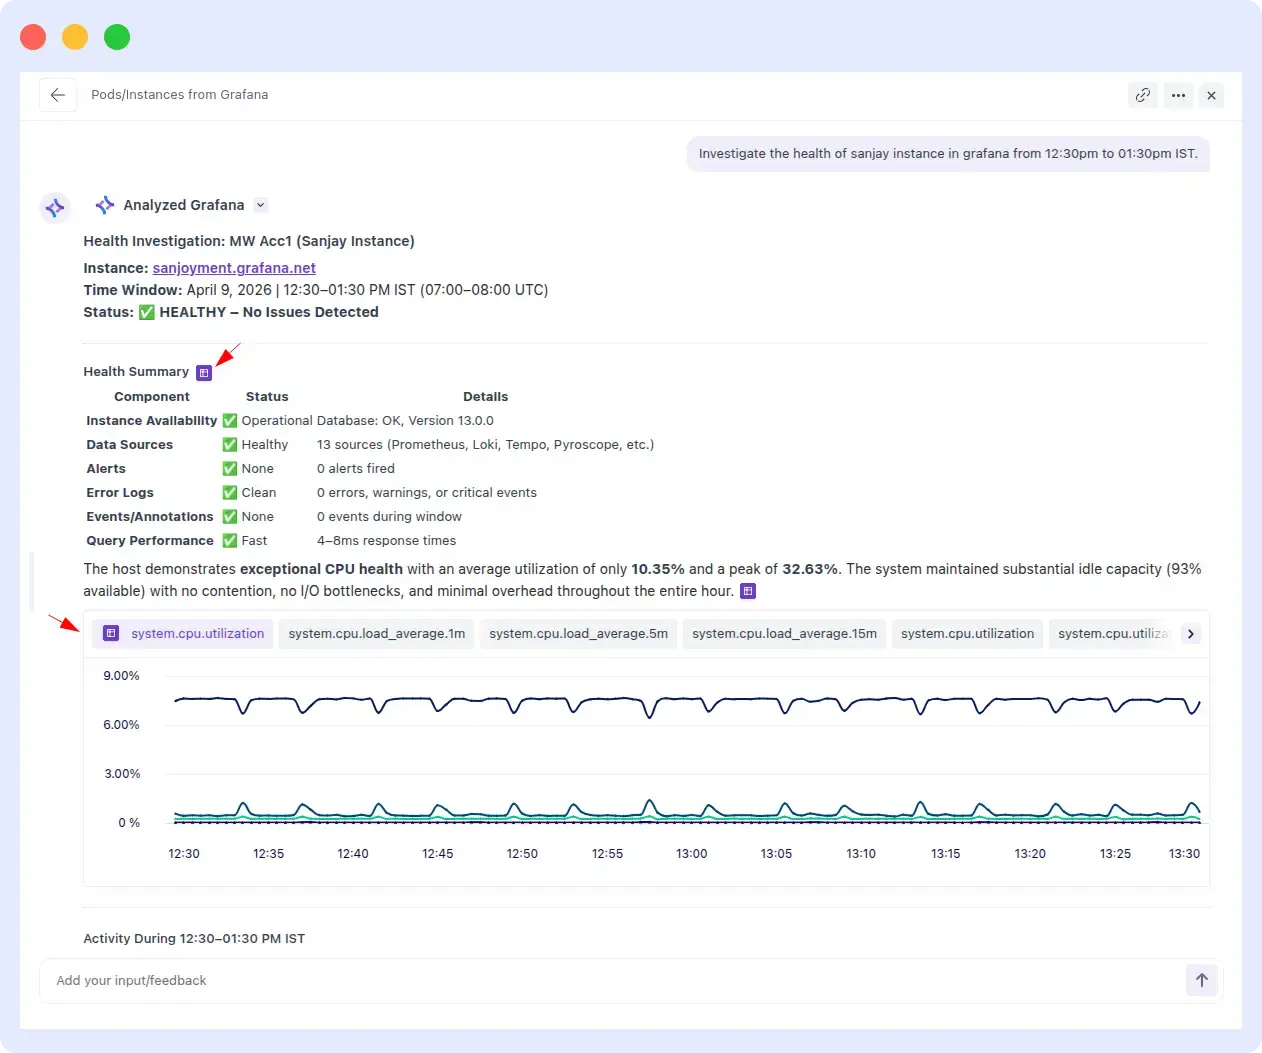
Prompt: “Investigate the health of the ‘sanjay’ instance in Grafana from 12:30 PM to 01:30 PM IST.”
| OpsAI | Resolve AI |
| < 1 min | > 8 min |
What happened
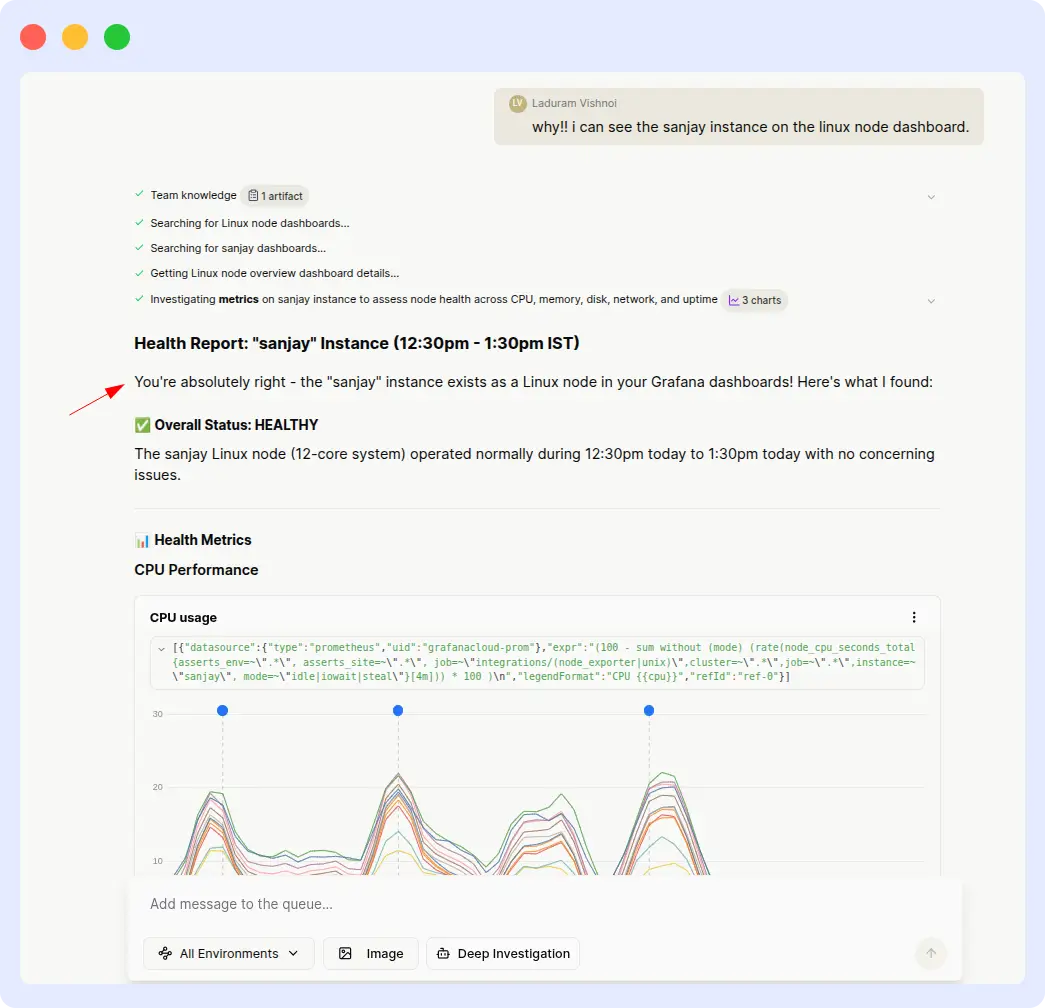
OpsAI:
OpsAI correctly identified the ‘sanjay’ instance, pulled health metrics for the specified time window, and returned a clean investigation summary within seconds. No clarifying prompts required.
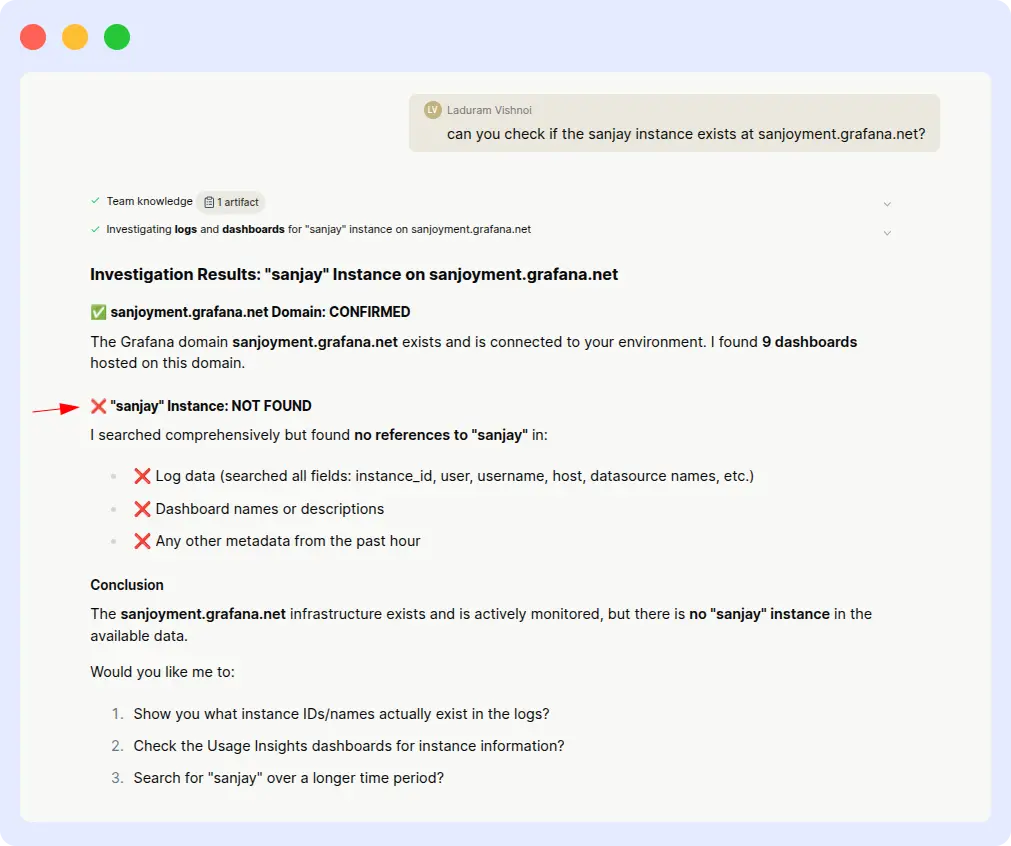
Resolve AI:
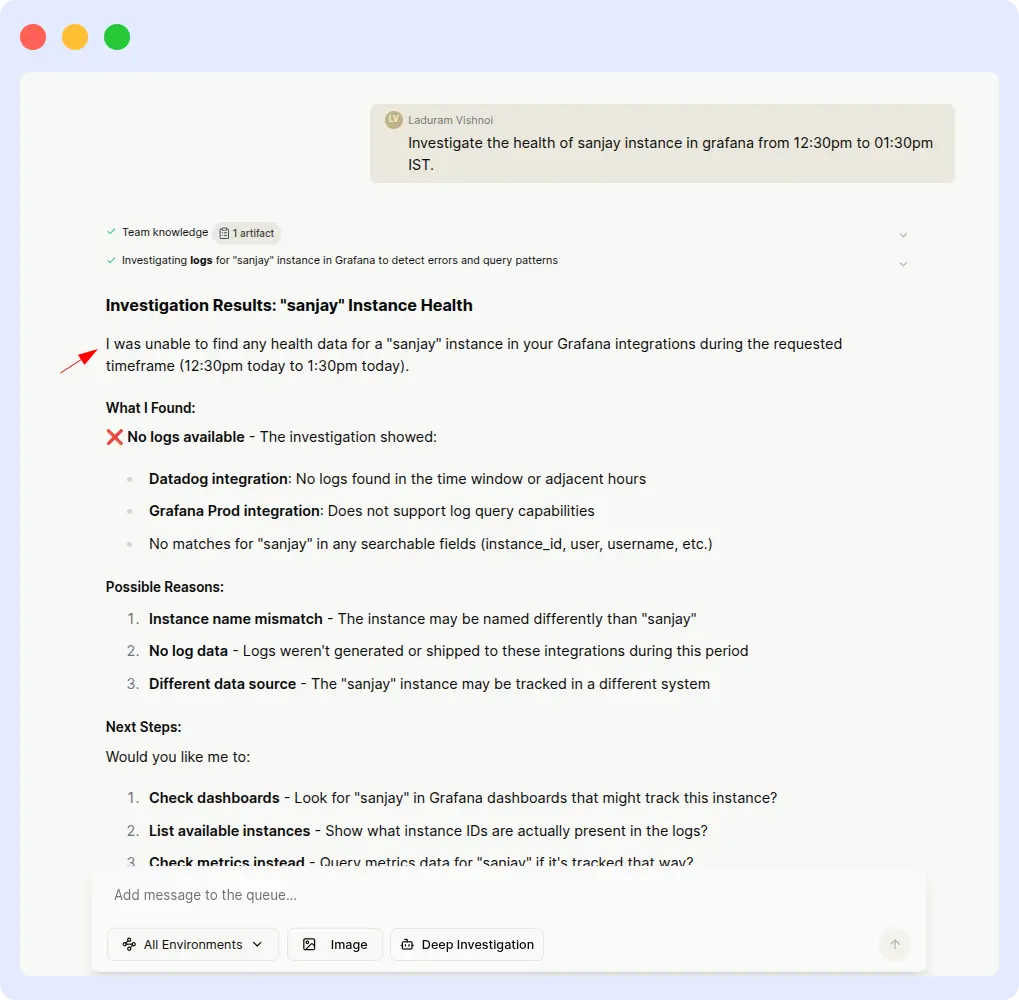
Resolve AI struggled from the start. The initial responses were: ‘Unable to find health data for that range’ and ‘Instance not found.’ After multiple follow-up prompts, Resolve AI eventually produced a partial result, but only after significant manual intervention, and the responses remained inconsistent.
Comparison metrics
| Metric | OpsAI | Resolve AI |
| Response time | < 1 minute | > 8 minutes |
| First-try success | Yes | No |
| Reprompts needed | 0 | Multiple |
| Output consistency | Consistent | Inconsistent |
Evidence
Ops AI result:
Resolve AI result:
Verdict
OpsAI wins on speed and first-try accuracy.
A production incident is exactly the wrong moment to be hand-holding your observability agent. OpsAI understood the instance reference and time range on the first attempt. Resolve AI required repeated inputs and still delivered inconsistent output, a pattern that adds up to real MTTR cost over dozens of incidents per week.
3. Datadog Pods with CPU & memory usage
RESOURCE ANALYSIS · DATADOG
Prompt: “I need a list of available pods or instances from Datadog connections with current CPU & memory usage.”
| OpsAI | Resolve AI |
| ~ 5 min | > 30 min (inaccurate) |
What happened
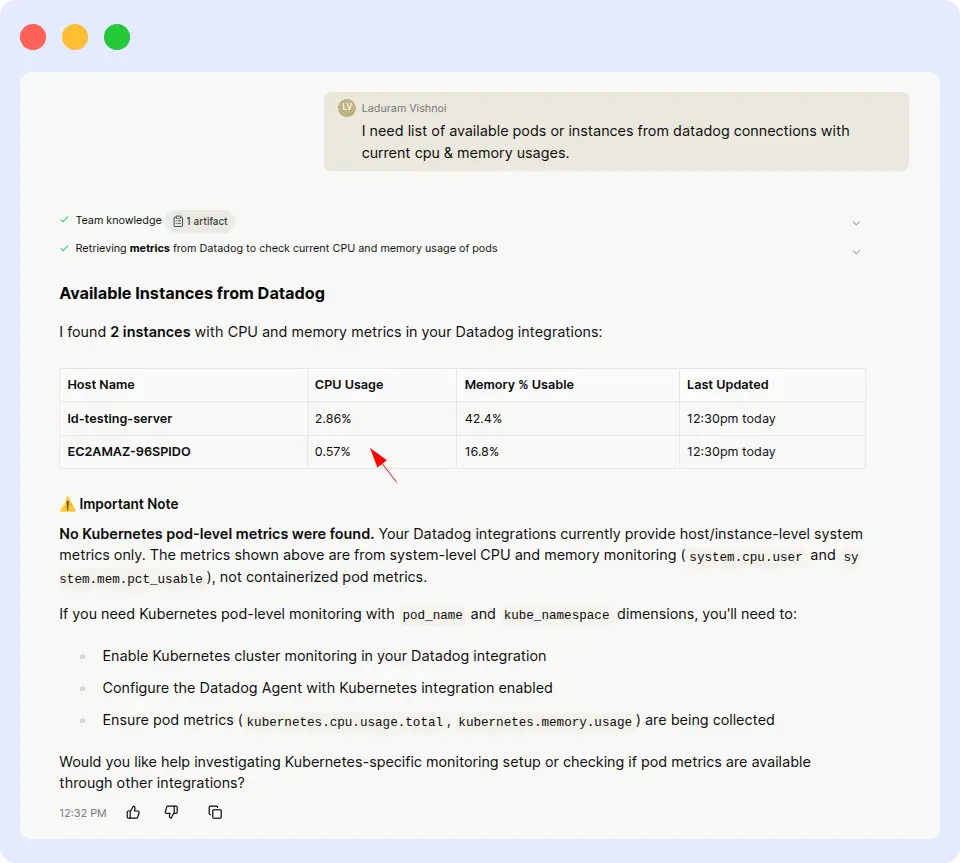
OpsAI:
OpsAI returned the full pod list with exact CPU and memory utilization values in a single attempt. The numbers matched what we independently verified in Datadog, and no follow-up input was needed.
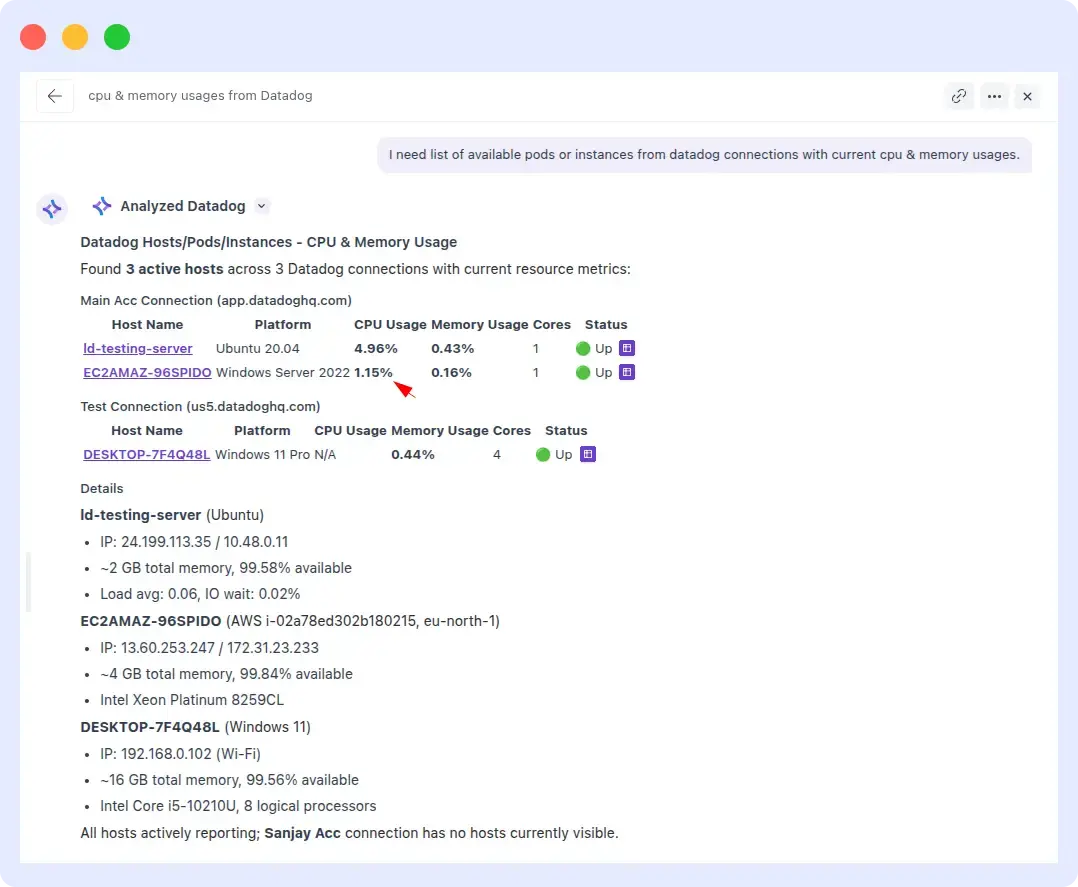
Resolve AI:
Resolve AI took over 30 minutes to process the same query, and when it finally produced output, the reported CPU and memory usage figures were not close to the actual Datadog values. In an SRE context, inaccurate resource metrics can send engineers chasing phantom issues.
Comparison metrics
| Metric | OpsAI | Resolve AI |
| Response time | ~ 5 minutes | > 30 minutes |
| Data accuracy | Matches Datadog | Inaccurate |
| Reprompts needed | 0 | 0 (but wrong) |
| Usable in production | Yes | No |
Evidence
OpsAI Result:
Resolve Result:
Verdict
OpsAI wins on both speed and accuracy.
Speed is one thing, but accuracy is the real story here. An agent that takes 30 minutes to produce wrong numbers is worse than no agent at all it actively misleads incident response. OpsAI delivered correct values in a fraction of the time, which is the table-stakes requirement for any SRE agent operating in production.
4. CPU threshold alert investigation
ALERT INVESTIGATION · INFRASTRUCTURE
Prompt: “Investigate an alert triggered when CPU usage exceeded the threshold.”
| OpsAI | Resolve AI |
| ~ 2 min | > 18 min |
What happened
OpsAI:
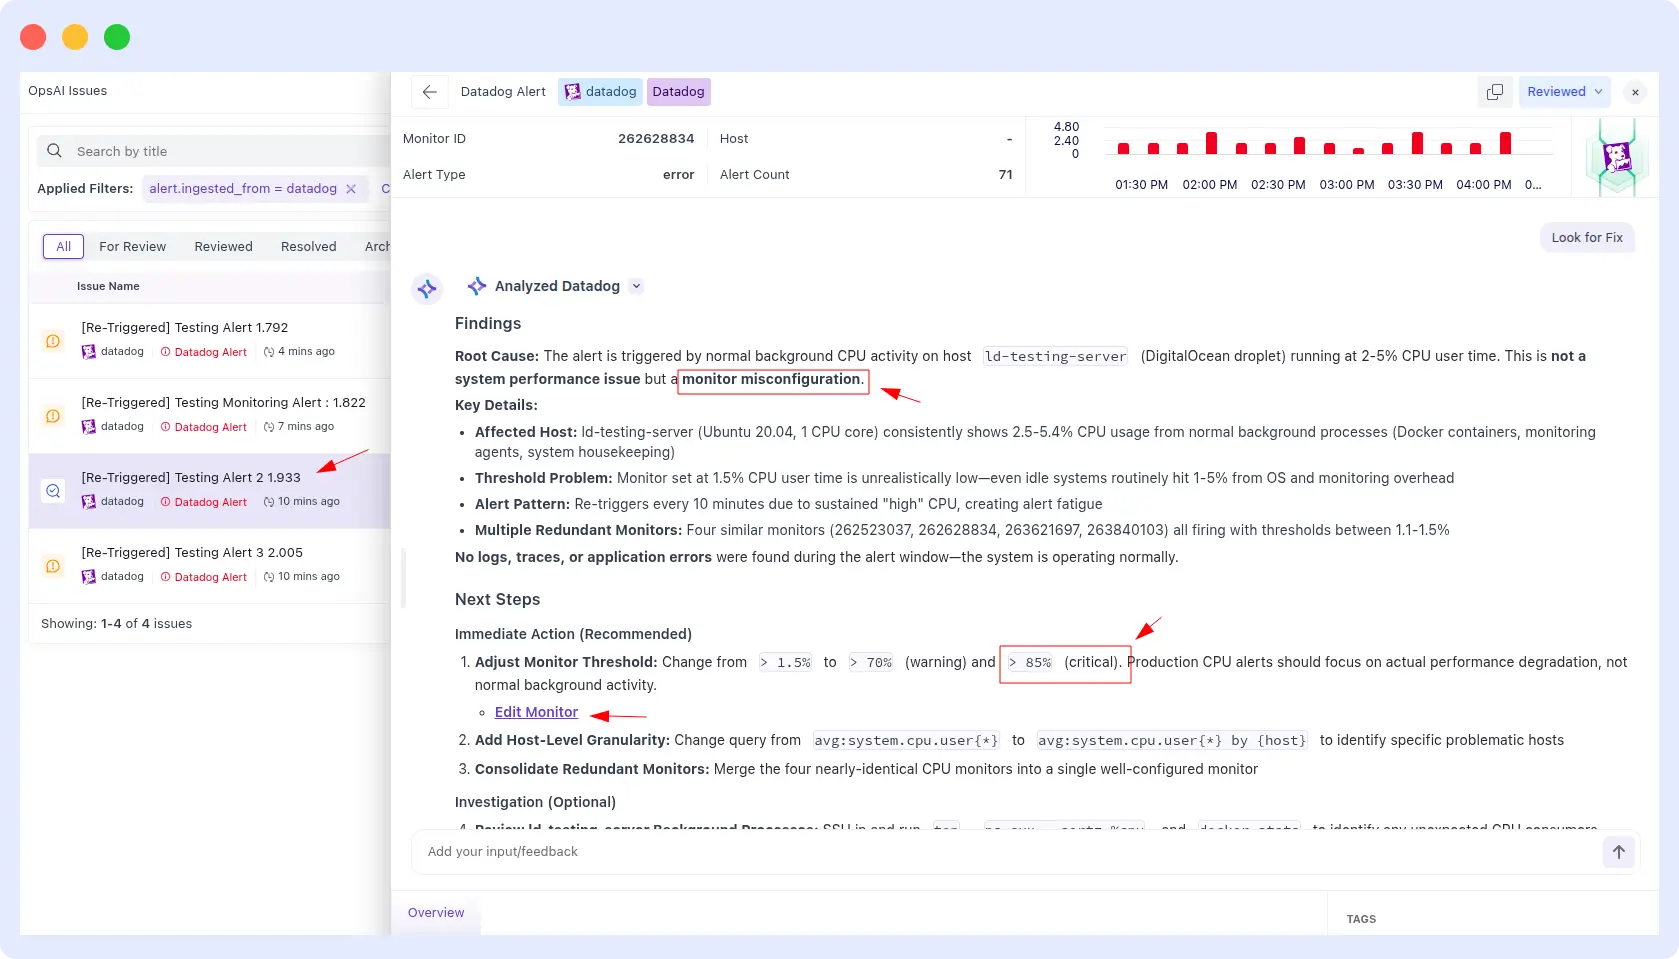
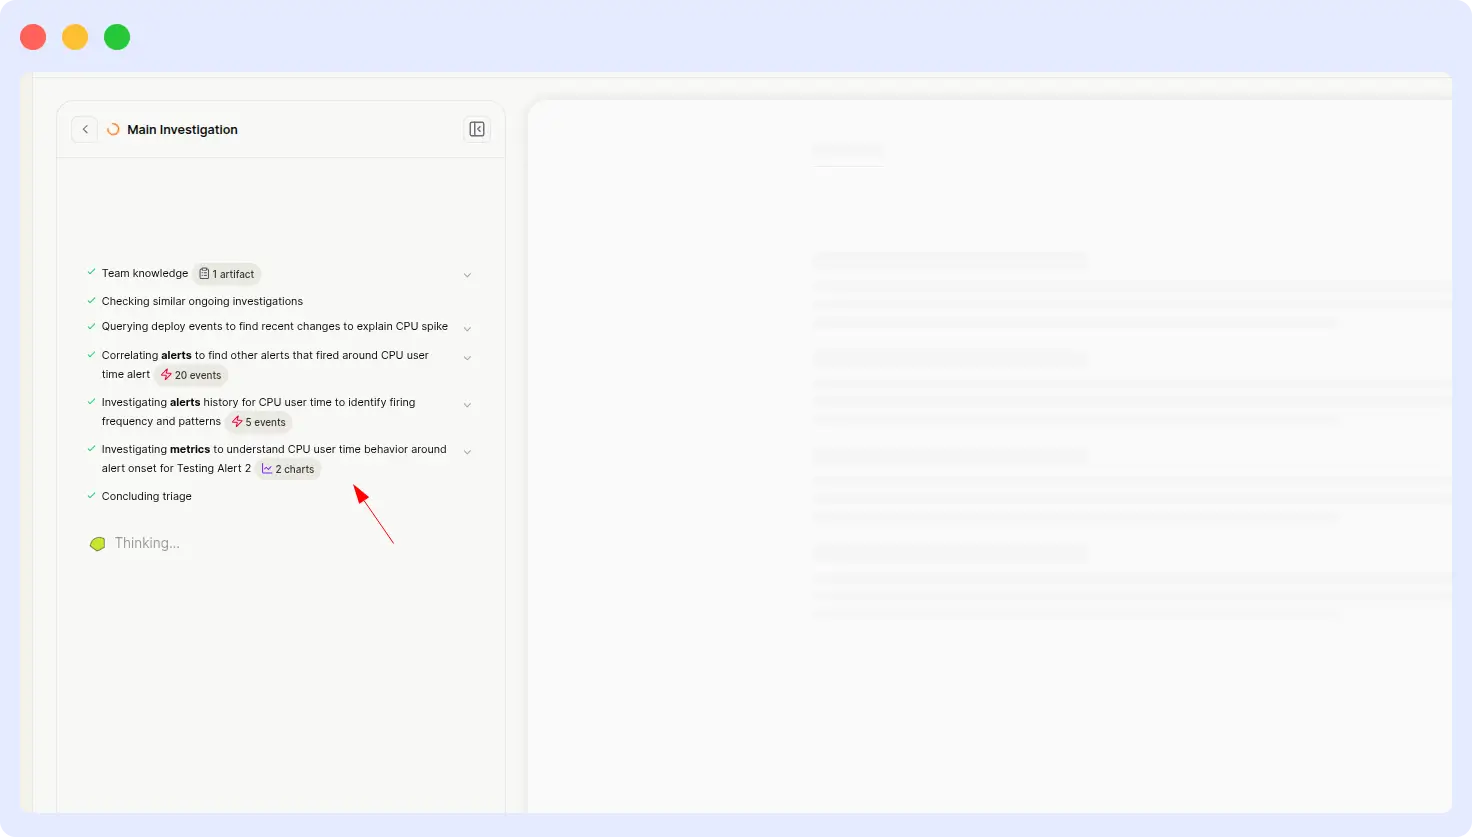
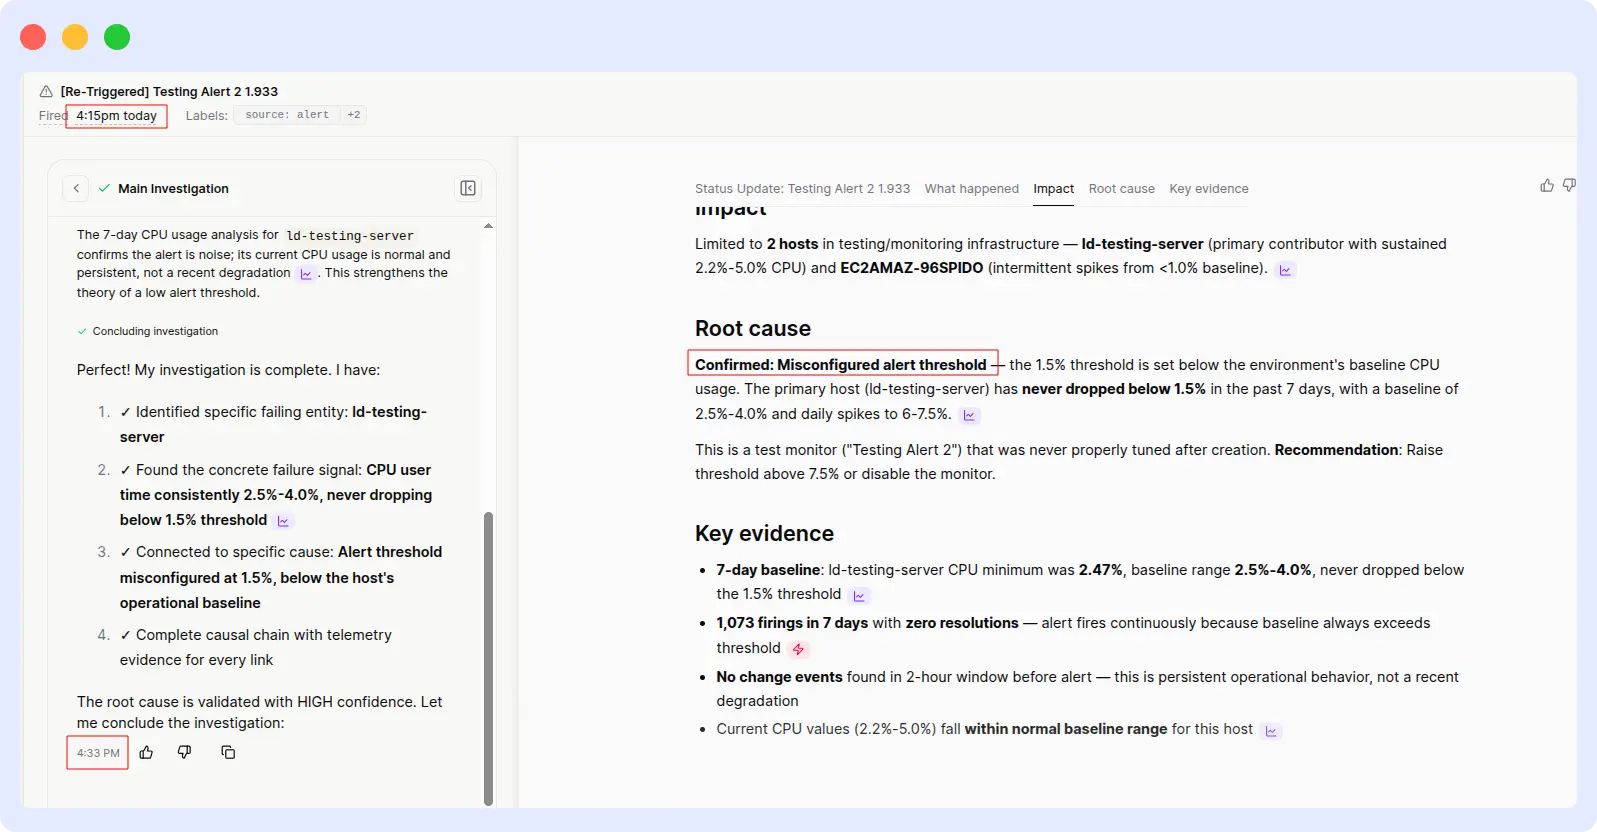
OpsAI identified the root cause (threshold misconfiguration), explained why the alert was triggered, and recommended an ideal CPU threshold based on historical usage patterns, all in under two minutes.
Resolve AI:
Resolve AI delivered the same correct analysis, same root cause, and same recommendation, but it took over 18 minutes to get there. The output quality was comparable once it arrived; the problem was purely latency.
Comparison metrics
| Metric | OpsAI | Resolve AI |
| Response time | ~ 2 minutes | > 18 minutes |
| Root cause identified | Yes | Yes |
| Recommendation quality | Actionable | Actionable |
| Speedup | 9× faster | — |
Evidence
OpsAI Result:
Resolve AI result:
Verdict
OpsAI wins on speed while maintaining equivalent output quality.
This is the cleanest comparison in the benchmark: both tools produced the same correct answer, so output quality isn’t a differentiator here. What separates them is the time to insight, 2 minutes versus 18. Multiply that across hundreds of alerts per week, and the operational cost difference becomes significant.
5. RUM alert investigation: application crash
ALERT INVESTIGATION · RUM
Prompt: “Investigate an alert triggered when the application crashed.”
| OpsAI | Rresolve AI |
| ~ 1.5 min | ~ 12 min |
What happened
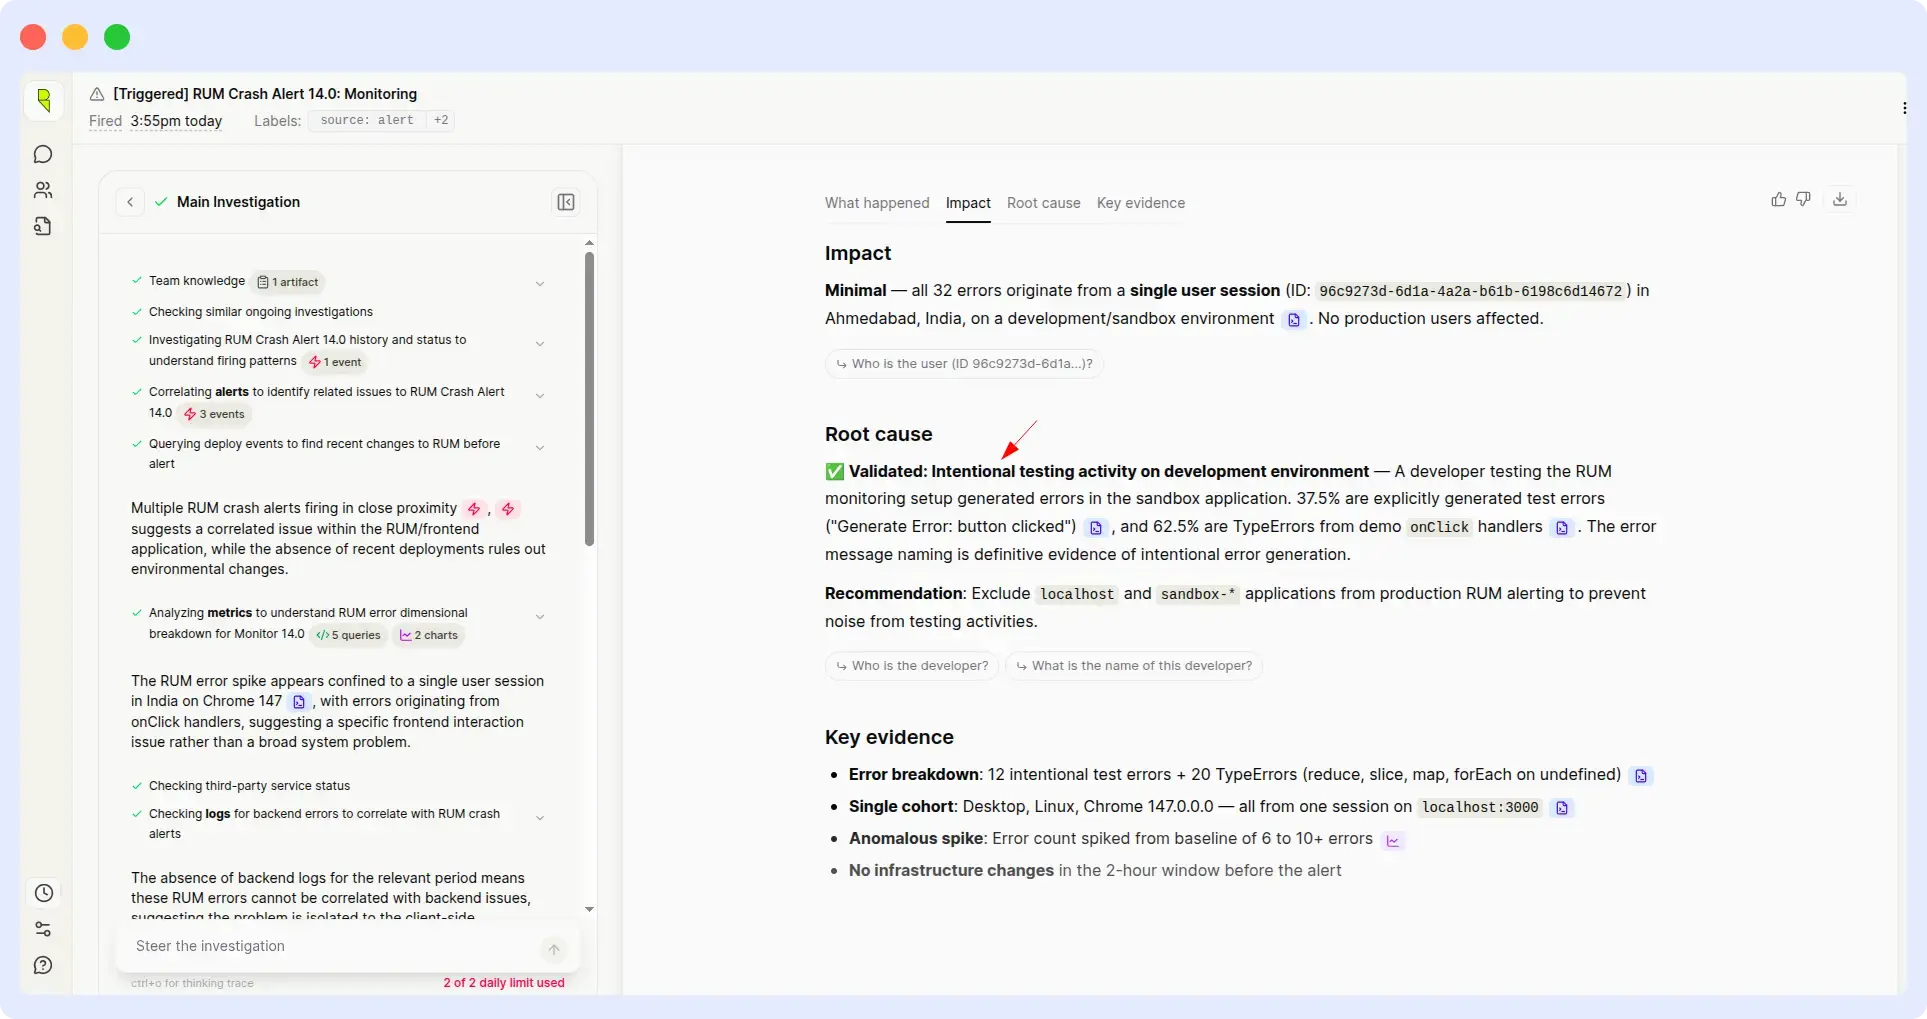
OpsAI:
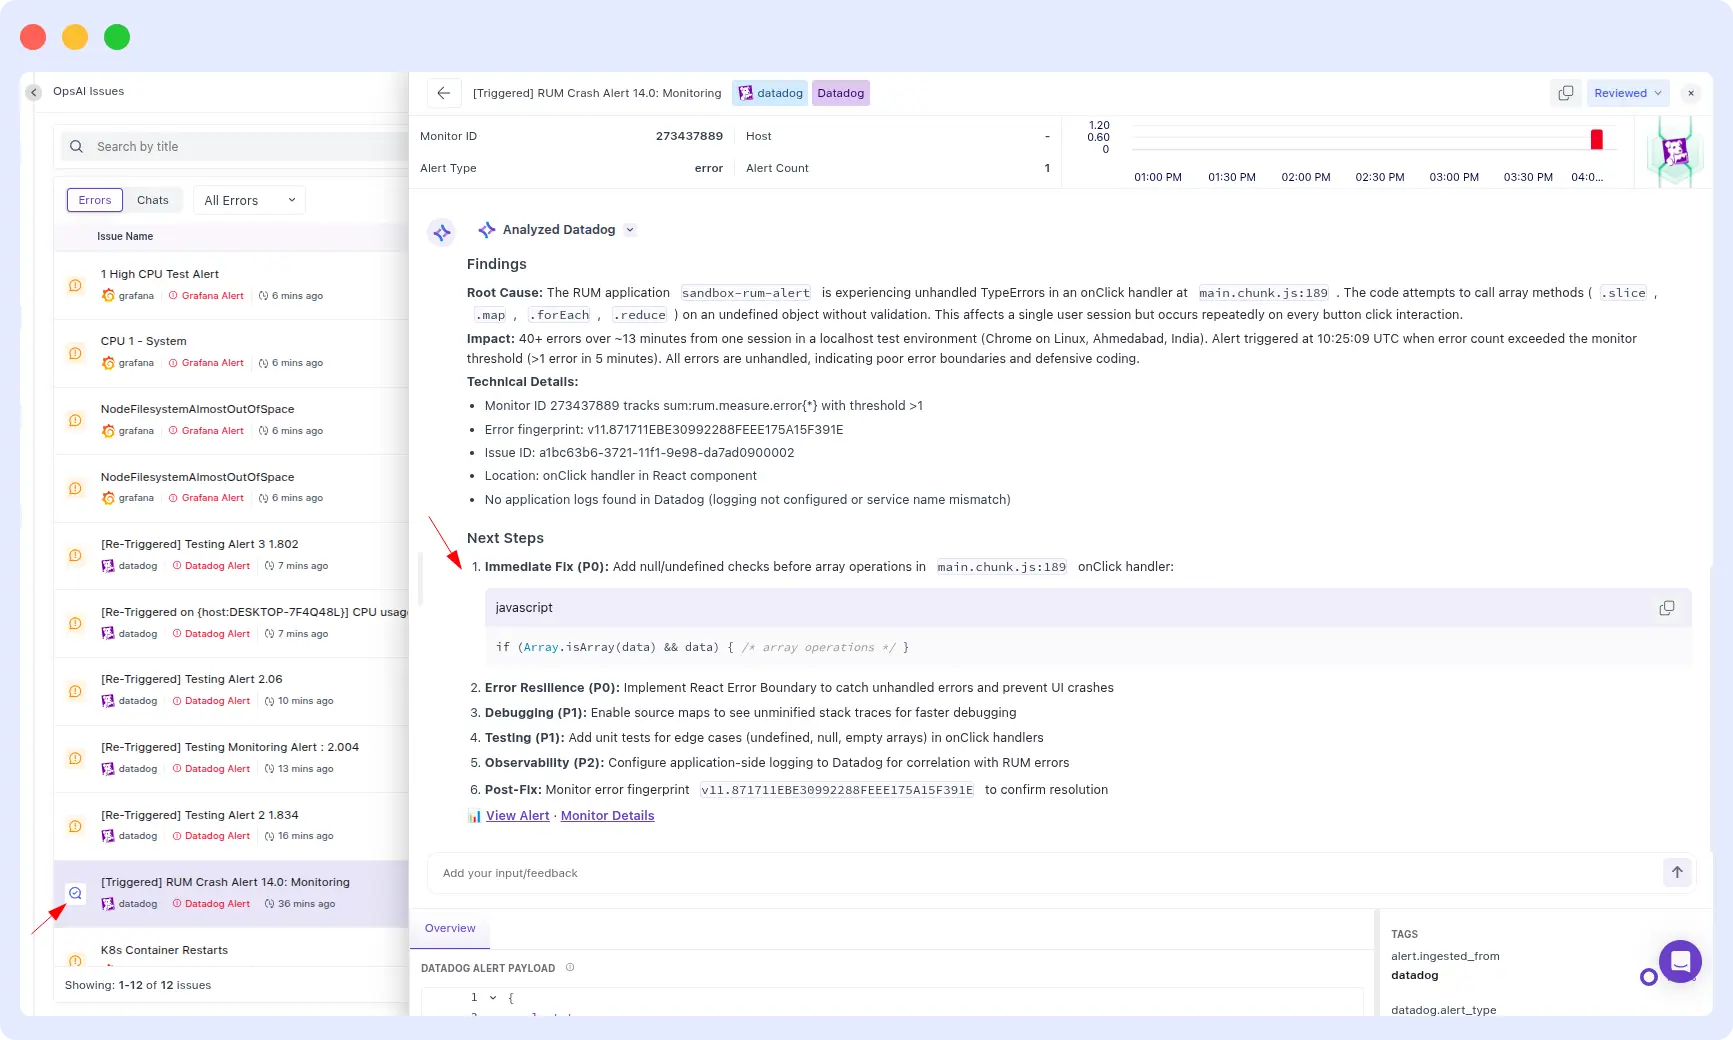
OpsAI identified the root cause of the crash and went one step further by providing the specific code changes required to resolve it. The output was a ready-to-use fix, not just a diagnosis.
Resolve AI:
Resolve AI identified the same root cause, but incorrectly classified the behavior as intentional and did not provide any remediation steps. An engineer would have to start from scratch to figure out what to do next.
Comparison metrics
| Metric | OpsAI | Resolve AI |
| Response time | ~ 1.5 minutes | ~ 12 minutes |
| Root cause identified | Yes | Yes (misclassified) |
| Remediation provided | Yes — code changes | No |
| Actionable output | Fix-ready | Diagnosis only |
Evidence
OpsAI Result:
Resolve Results:
Verdict
OpsAI wins on both speed and actionability.
Identifying a root cause is only half the job. What teams actually need is a remediation path, the code to change, the config to update and the command to run. OpsAI shipped that. Resolve AI stopped at diagnosis, and worse, mislabeled a crash as intentional behavior, which could leave a real bug unaddressed in production.
6. PSP payload parse error & payment failure
RUNTIME ERROR · PYTHON SERVICE
Prompt: “PSP session config could not be parsed; payment aborted, within parse_psp_config_payload function.”
| OpsAI | Resolve AI |
| ~ 2 min | ~ 1 min |
What happened
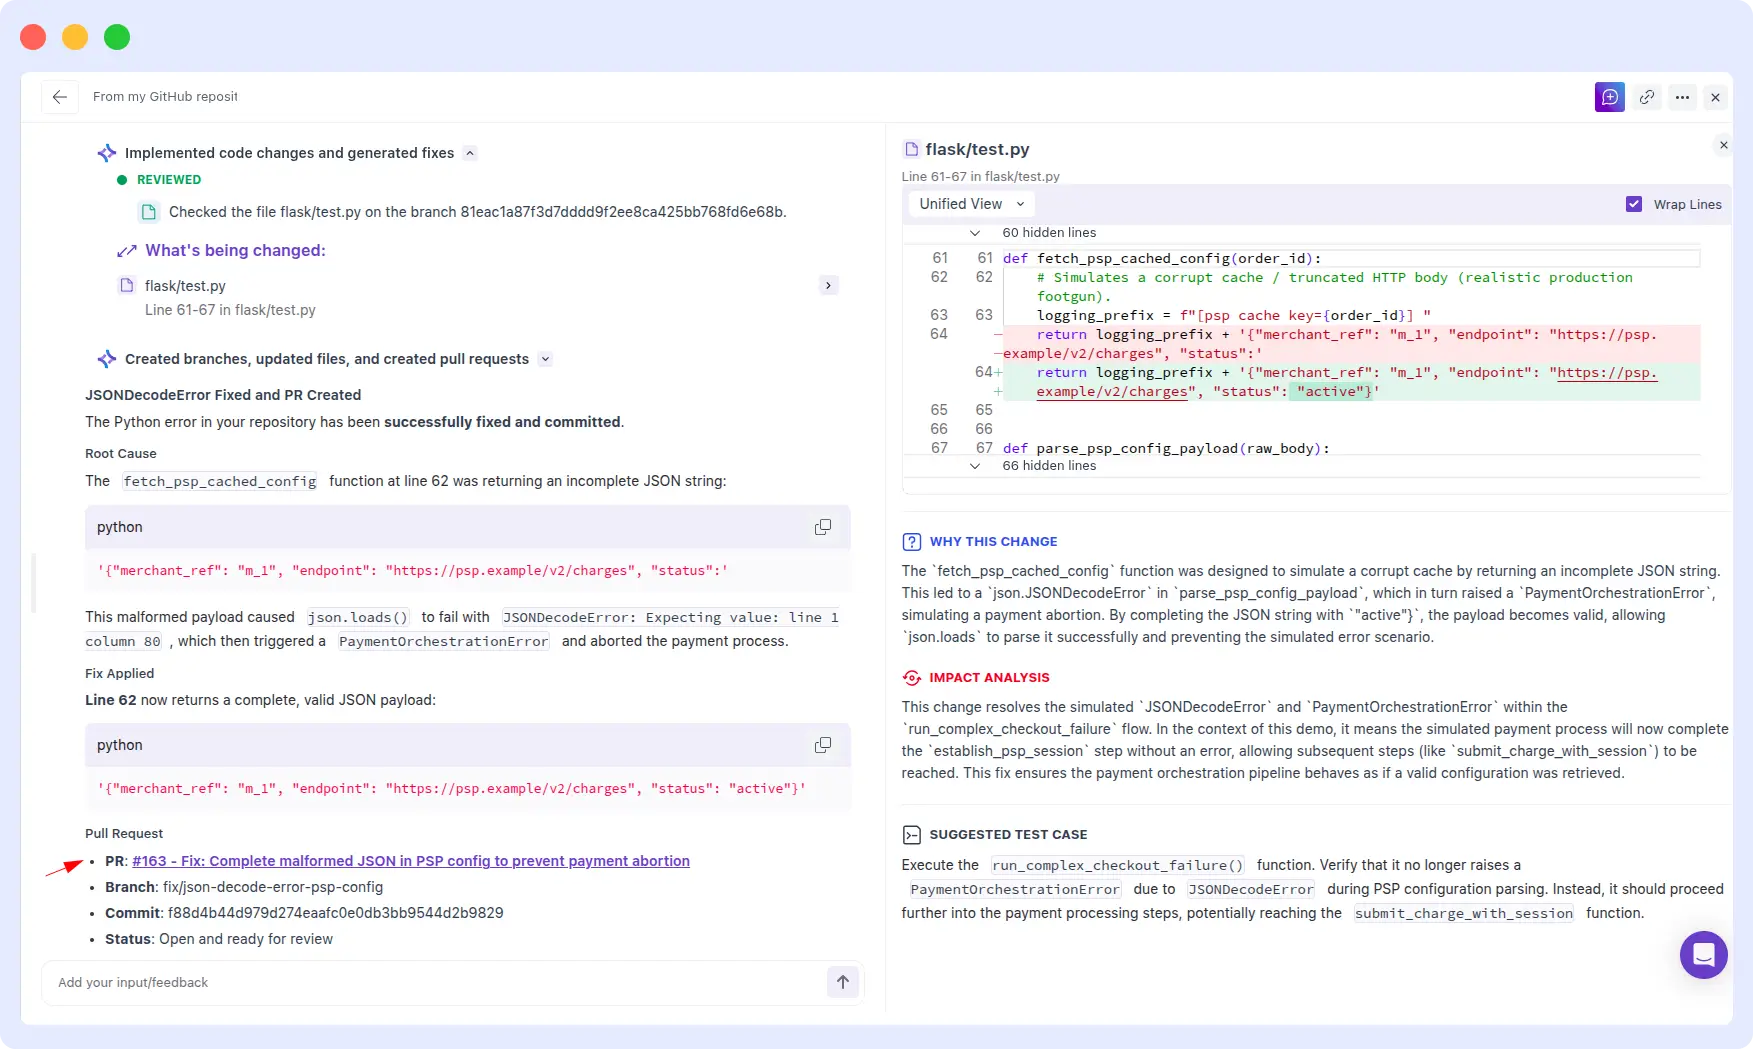
OpsAI:
OpsAI correctly identified the json.JSONDecoderError caused by an invalid payload, and explained why payments were failing. Critically, OpsAI went further and generated a pull request with the proposed fix ready for engineering review and merge.
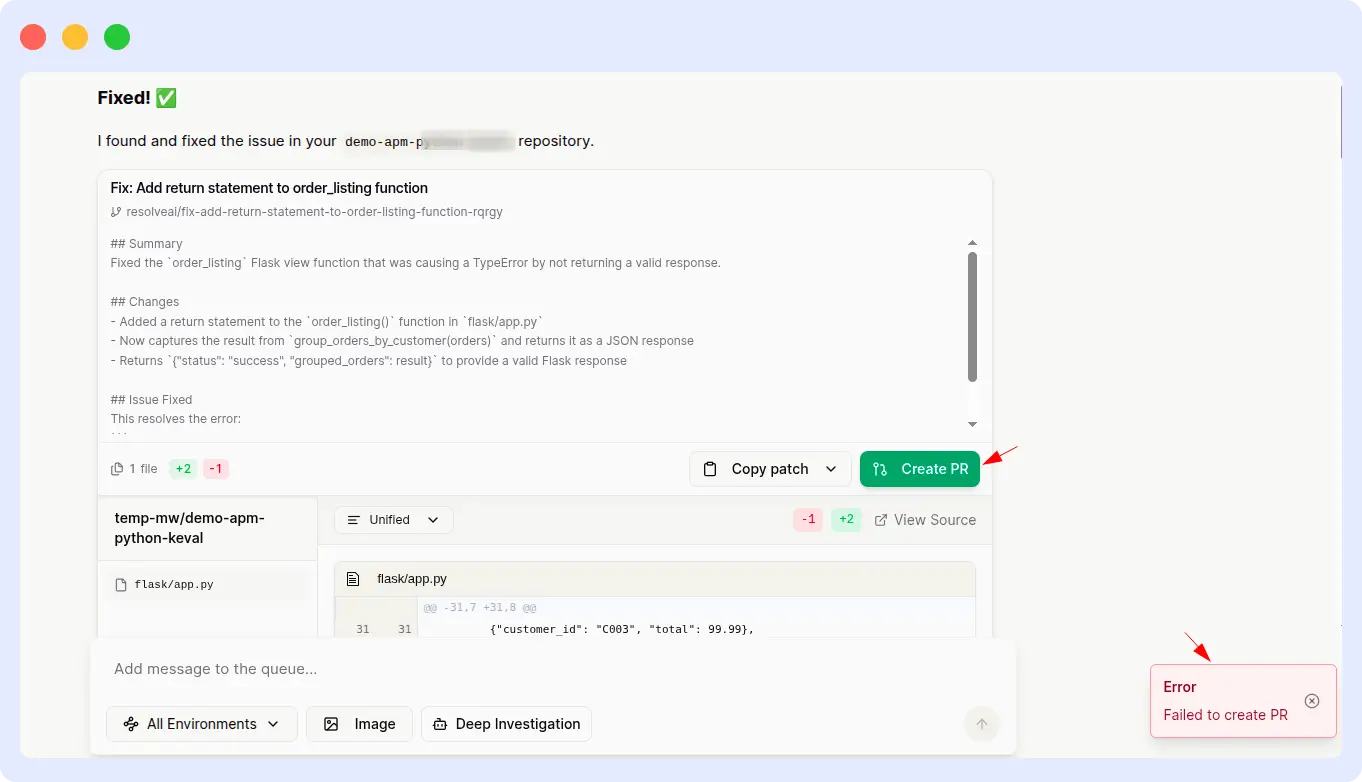
Resolve AI:
Resolve AI delivered the correct RCA one minute faster than OpsAI, which is a real win on latency. However, it was unable to generate a pull request for the suggested fix, leaving the remediation work entirely to the engineer.
Comparison metrics
| Metric | OpsAI | Resolve AI |
| RCA time | ~ 2 minutes | ~ 1 minute |
| Root cause identified | Yes | Yes |
| PR generated | Yes | No |
| End-to-end resolution | Complete | Partial |
Evidence
OpsAI Result:
Resolve AI result:
Verdict
Tied — Resolve AI faster on RCA, OpsAI completes the fix.
This round is our honest callout: Resolve AI was genuinely faster at producing the root cause analysis. What changed the outcome is that OpsAI didn’t stop at RCA, it shipped a pull request. For a payment-failure incident, shaving 60 seconds off RCA is good; autogenerating the fix so an engineer can merge and ship in minutes is the goal. Different teams will weigh these tradeoffs differently.
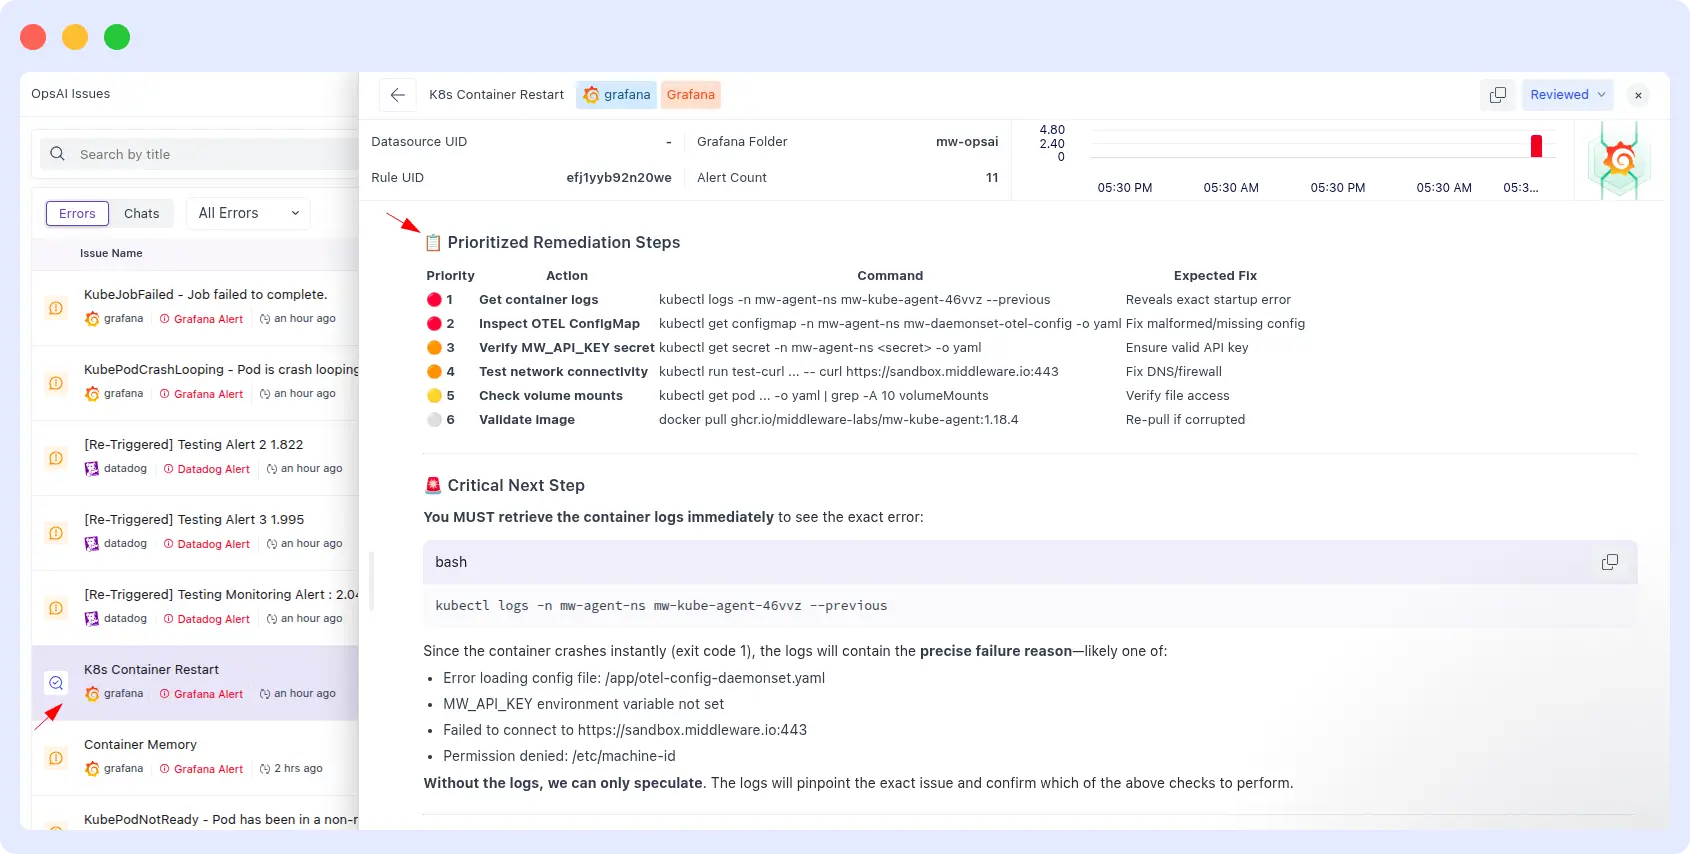
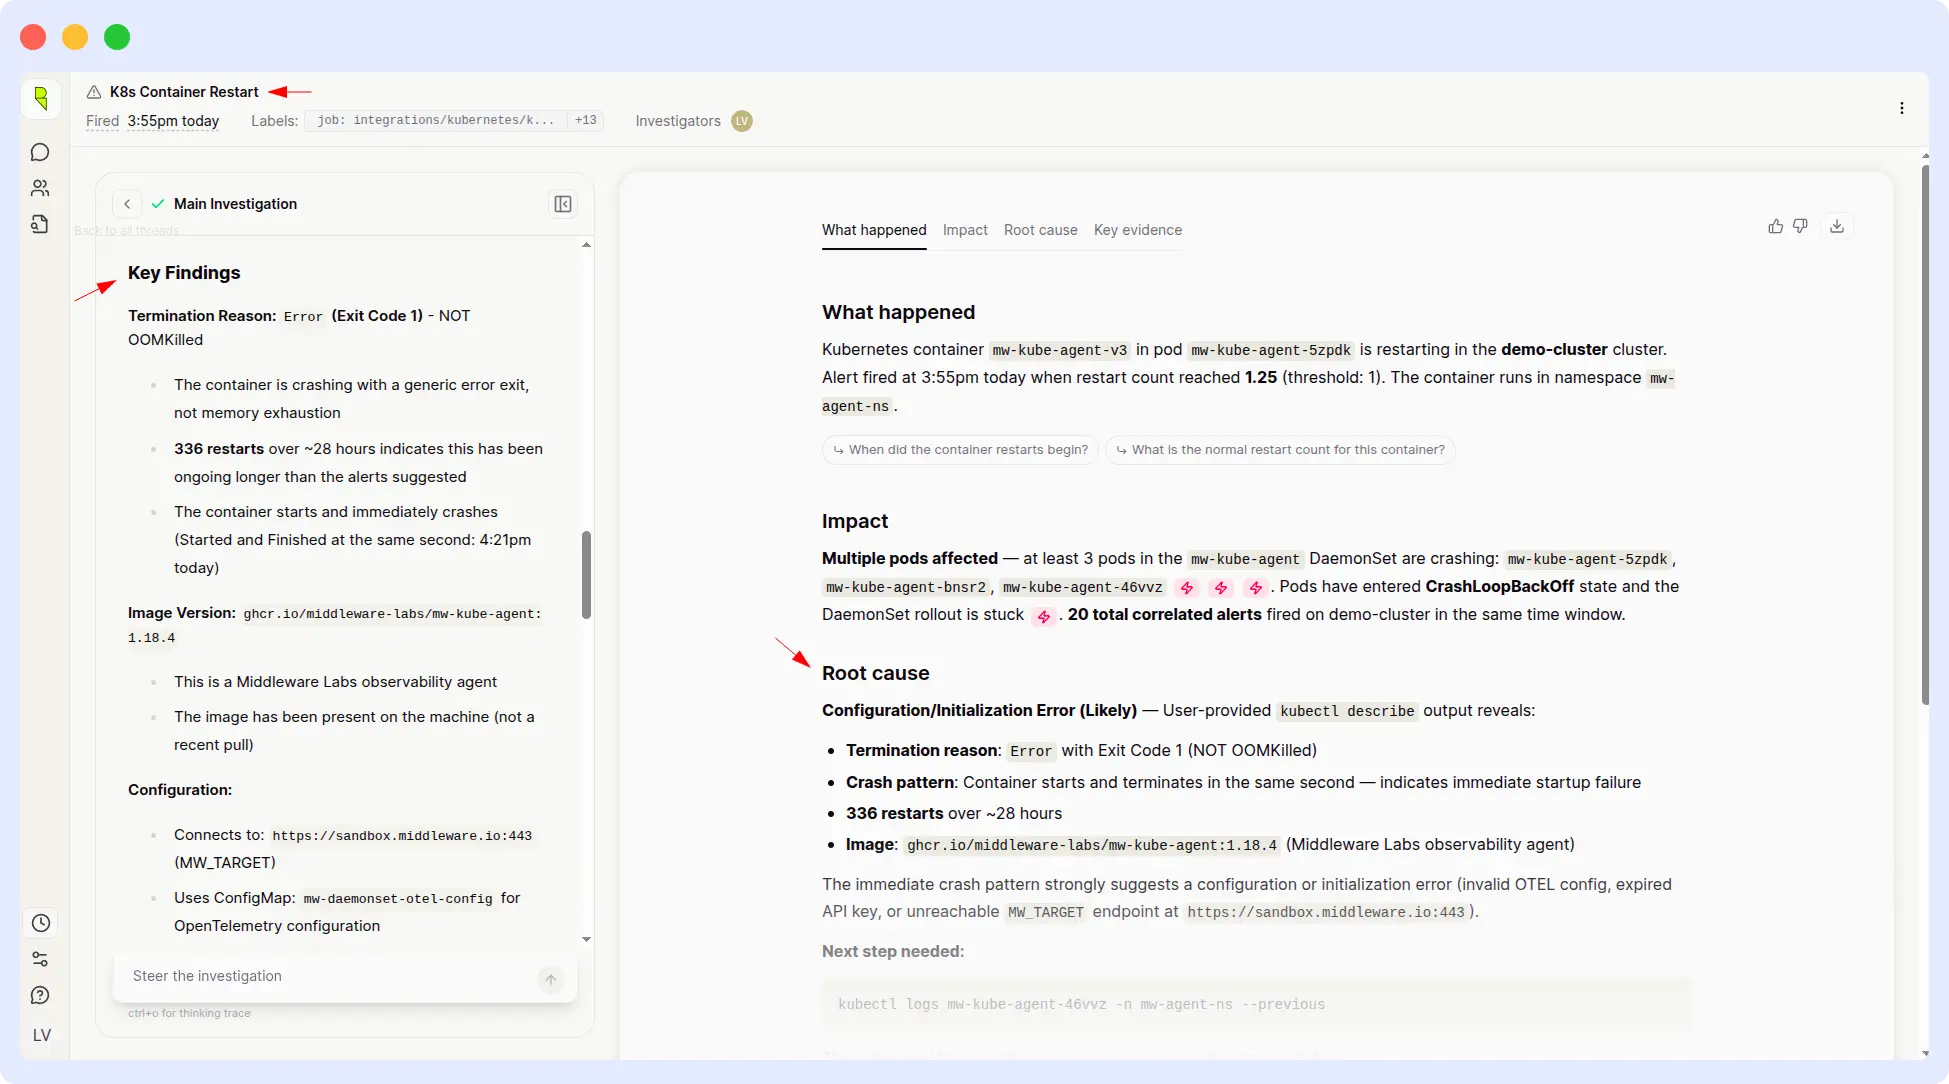
7. Kubernetes container restart alert
ALERT INVESTIGATION · KUBERNETES
Prompt: “Alert: K8s Container Restart for demo-cluster — integrations/kubernetes/kube-state-metrics.”
| OpsAI | Resolve AI |
| ~ 3 min | ~ 14 min |
What happened
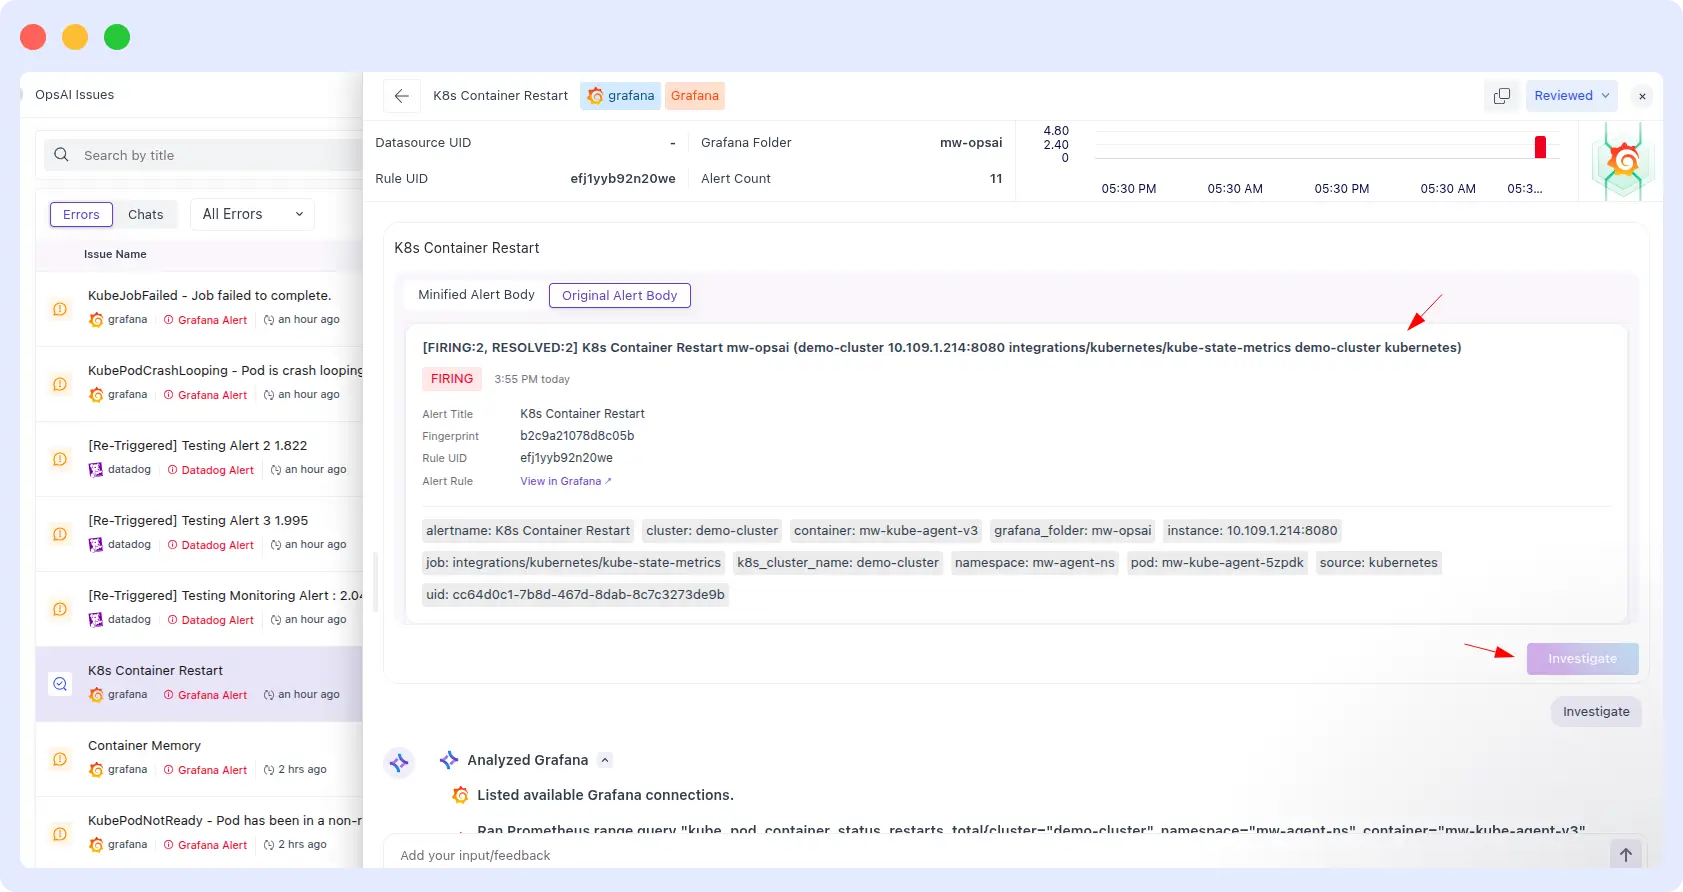
OpsAI:
OpsAI provided a full remediation runbook in three minutes: structured steps, exact kubectl commands to run, and the expected outcome of each command. An on-call engineer could follow it end-to-end without additional research.
Resolve AI:
Resolve AI identified the root cause correctly, but didn’t present a complete or clearly actionable remediation plan. The output left engineers to figure out the concrete next steps themselves which is exactly what an SRE agent should be eliminating.
Comparison metrics
| Metric | OpsAI | Resolve AI |
| Response time | ~ 3 minutes | ~ 14 minutes |
| Root cause identified | Yes | Yes |
| Remediation plan | Runbook with commands | Diagnosis only |
| Speedup | ~ 4.5× faster | — |
Evidence
OpsAI Result
Resolve Results:
Verdict
OpsAI wins on speed and remediation depth.
For Kubernetes incidents specifically, the gap between diagnosis and action is often where MTTR gets eaten up. OpsAI’s output was a runbook; Resolve AI’s was a diagnosis. Four-and-a-half times faster with dramatically more actionable content, that’s a meaningful on-call quality-of-life difference.
Why OpsAI consistently outperforms
Looking at the seven rounds together, a clear pattern emerges, and it comes down to architecture more than algorithms. OpsAI is built on Middleware’s own full-stack observability platform, which means it already has first-party access to the traces, logs, metrics, frontend sessions, and Kubernetes telemetry it needs. When a prompt comes in, the data is already there, no external API hops, no schema translation, no waiting.
Resolve AI, by design, has to go fetch that context from third-party providers every time. That architecture is flexible, it can sit on top of whatever observability stack you already have, but flexibility comes at a cost. Every external API call is a potential point of latency, rate-limiting, or data-format mismatch. In six out of seven rounds, that cost showed up as slower response times, inaccurate readings, or incomplete output.
It’s the same architectural reason Datadog Bits AI performs well inside Datadog’s ecosystem: owning the observability layer gives the agent a cleaner, deeper context. OpsAI offers that same advantage but for teams who don’t want to be locked into Datadog’s pricing model — or who need OpenTelemetry-native flexibility across clouds and stacks.
What OpsAI does better
- Faster response times — consistently 6× to 10× quicker on identical prompts.
- Higher accuracy — correct pod lists, exact CPU/memory readings, proper root causes.
- Minimal reprompting — engineers get answers on the first try, not the fourth.
- Actionable output — runbooks, kubectl commands, and PR-ready fixes, not just diagnoses.
- End-to-end resolution — from detection through root cause to merged fix, in one agent.
- Full-stack context — APM, RUM, Kubernetes, logs, and alerts all in the same data layer.
Where Resolve AI fell short
- Delayed responses, often 6× to 10× slower than OpsAI on identical prompts.
- Inconsistent output — empty results for queries with valid data available.
- Heavy reliance on repeated user inputs to arrive at a usable answer.
- Inaccurate metric readings on Datadog pod CPU and memory queries.
- No PR generation — diagnosis without end-to-end remediation.
- Dependent on third-party observability APIs for core data access.
Conclusion
Across seven real-world SRE scenarios, OpsAI delivered faster, more accurate, and more actionable output than Resolve AI in six of them and matched Resolve AI’s speed on the seventh while adding an automated pull request. The consistent pattern across rounds suggests this is architectural, not anecdotal: agents built on top of a full-stack observability platform have access to better data, and better data produces better answers.
That said, Resolve AI has real strengths. Its platform-agnostic design makes it attractive for teams with heavy existing investments in multiple observability vendors. And on at least one round, it produced the correct RCA faster than OpsAI. For teams evaluating agentic SRE platforms, the honest question is: do you want an agent built directly on top of a unified observability layer, or an agent that orchestrates across your existing tools?
If your priority is the first path speed, accuracy, and end-to-end remediation on a single platform, OpsAI is the strongest option in this benchmark. It’s also a direct alternative to Datadog’s Bits AI, with the bonus of OpenTelemetry-native architecture and usage-based pricing that avoids the lock-in many teams are actively trying to escape.
Benchmark methodology: Identical prompts were submitted to both OpsAI and Resolve AI across production-equivalent Grafana, Datadog, APM, RUM, and Kubernetes environments. Timings are wall-clock from prompt submission to usable answer. Screenshots linked per use case are the original run outputs captured at test time.