
New Relic and Sentry both monitor production software, but they solve different problems. New Relic covers apps, infrastructure, logs, browsers, mobile, Kubernetes, and synthetics on a single platform. It also includes APM and distributed tracing. Sentry started as an error tracker for developers and has since expanded to include APM, logs, and session replay, but code remains its focus. New Relic answers, “Is the system healthy?”, while Sentry answers, “What broke, and which commit caused it?”
This article compares New Relic and Sentry on error tracking, APM, infrastructure monitoring, alerting, OpenTelemetry support, and pricing. We’ll also cover when teams can run both.
TL;DR
- New Relic is a full observability platform covering apps, infrastructure, logs, browsers, mobile, Kubernetes, and synthetics.
- Sentry is a developer-first tool focused on errors, traces, and session replay tied to specific commits.
- Pick New Relic if you need one platform for backend services, servers, Kubernetes, and logs, and SREs or platform engineers run your monitoring.
- Pick Sentry if your goal is to ship code with fewer bugs, your team works mostly in GitHub and the IDE, and frontend or mobile errors are your biggest pain.
- New Relic charges by data ingested plus platform users; bills get hard to predict as data volume grows. Sentry charges per event, replay, and span, with set monthly limits on each plan.
- Run both when the platform team uses New Relic for infrastructure and SLOs and the application team uses Sentry for code-level debugging. Smaller teams should stick with one.
New Relic vs Sentry: Quick comparison
| Criteria | New Relic | Sentry |
|---|---|---|
| Primary purpose | Full-stack observability | Error tracking and developer-focused APM |
| Scope | Apps, infrastructure, logs, browsers, mobile, Kubernetes, synthetics | Errors, traces, logs, session replay, profiling, browser, mobile |
| Instrumentation | Language agents for APM, separate agents for infrastructure, browser, and mobile. OpenTelemetry supported | SDKs only. No agents. OpenTelemetry supported |
| Infrastructure monitoring | Yes, with a dedicated infrastructure agent for hosts, containers, and Kubernetes | No |
| Error tracking depth | Errors appear inside APM with stack traces and transaction context | Issue grouping, breadcrumbs, suspect commits, source maps, session replay tied to each error |
| Pricing model | Pay per GB of data ingested plus per platform user. 100 GB free per month. | Per-event tiers (errors, replays, spans, logs). Free tier with set monthly limits. |
| Best fit | Platform and SRE teams running mixed workloads who want one tool for apps, infrastructure, and logs | Application developers who care most about catching, triaging, and fixing code-level bugs fast |
How do New Relic and Sentry compare?
New Relic and Sentry are compared across several areas, including error tracking, APM, infrastructure and logs, alerting, OpenTelemetry support, and more. The choice between them comes down to where the work happens: New Relic does more across the stack, while Sentry does more inside the code. The sections below break down where each one is stronger.
New Relic vs Sentry: error tracking
Sentry is stronger for code-level error tracking. New Relic catches and groups errors well, but Sentry’s workflow is built around fixing them.
In Sentry, every error lands as an issue with the stack trace, a breadcrumb timeline of what the user did before the crash, and tags for browser, OS, and release. If you’ve connected GitHub, Sentry flags the suspect commit that introduced the error and suggests the author as the assignee. Session Replay plays back the user session that triggered each error, with network requests and console logs synced to the timeline.
New Relic handles errors through Errors Inbox, which pulls errors from APM, browser, mobile, and serverless into one screen. Errors group by fingerprint, you can mark them as expected or assign them, and Slack integration pushes new groups to a channel. New Relic does not tie errors to specific commits, and its session replay sits in browser monitoring rather than next to each error.
Verdict: Pick Sentry if your priority is debugging and shipping fixes fast, especially for frontend or mobile code. Pick New Relic if errors are one signal among many and you want them in the same view as infrastructure and APM data.
New Relic vs Sentry: frontend monitoring
Sentry is built for frontend developers debugging JavaScript. New Relic is built for platform teams tracking user experience at scale.
Sentry’s Frontend Insights tracks Core Web Vitals (LCP, INP, CLS, FCP, TTFB) and rolls them into a Performance Score from 0 to 100 per page. Framework SDKs for React, Vue, Angular, Next.js, Remix, and Svelte auto-instrument page loads, route changes, and user interactions. Source maps de-minify JavaScript stack traces back to the original code, and session replay ties video-like recordings to each error and slow page load.
New Relic Browser tracks the same Core Web Vitals plus session traces, geography, and device breakdowns. New Relic Session Replay connects to Core Web Vitals data, so you can watch the user sessions behind a slow LCP score. New Relic also ties browser data to backend distributed traces and deployment markers, so you can see if a release broke a page load.
Verdict: Pick Sentry if frontend developers are the ones fixing the bugs and you want source maps, framework SDKs, and replay tied to each error. Pick New Relic if you want frontend data in the same view as backend traces, infrastructure, and deployments.
New Relic vs Sentry: APM and distributed tracing
New Relic offers a deeper APM platform. Sentry has real distributed tracing too, but it’s built around debugging code, not modeling services.
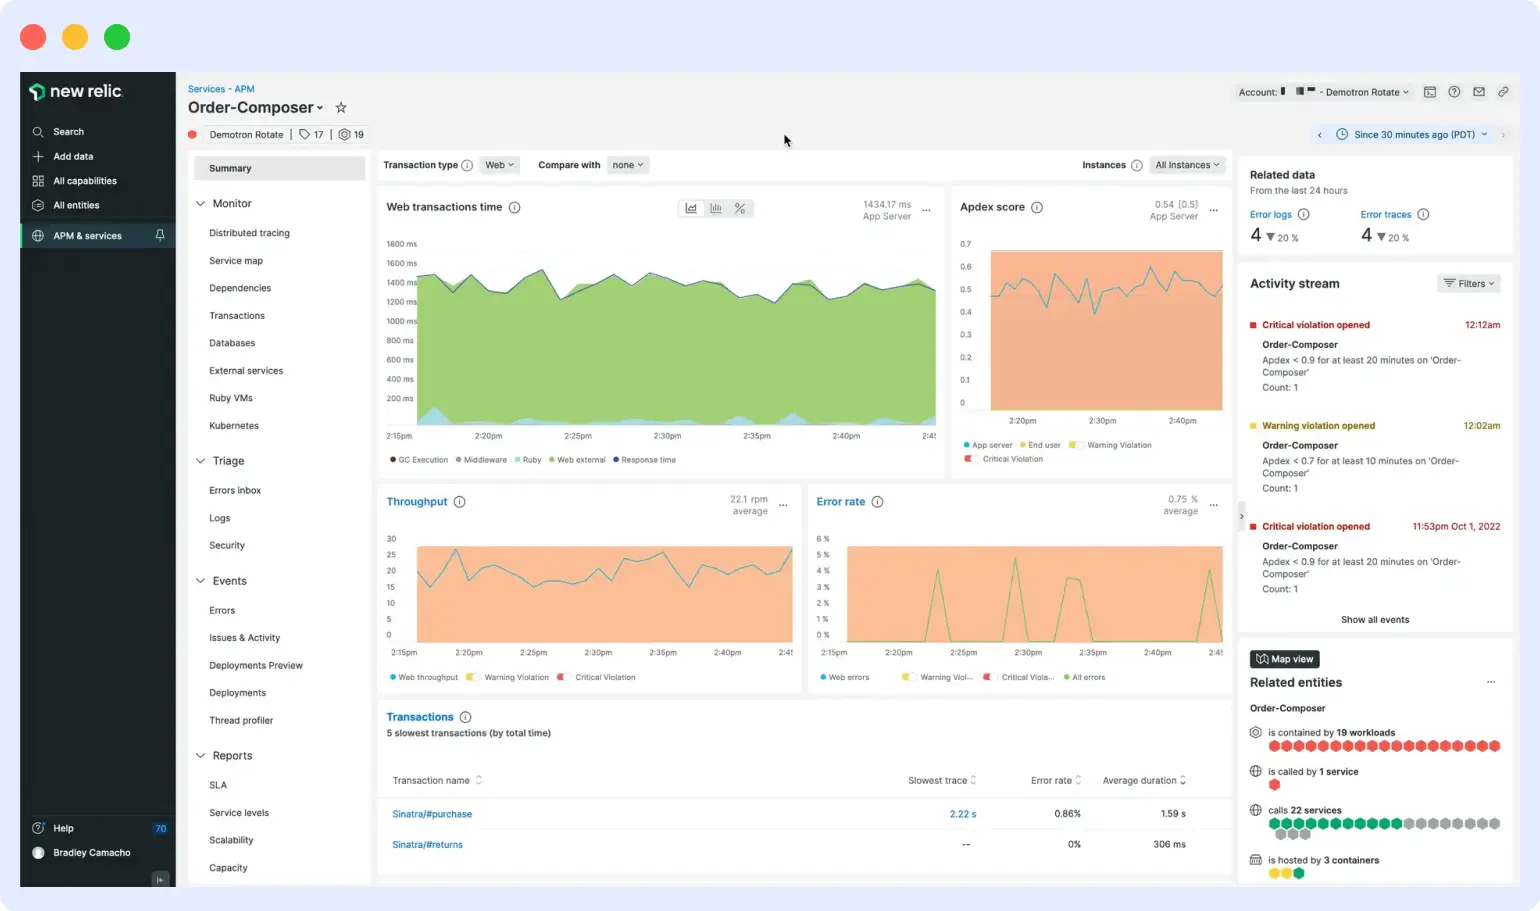
New Relic APM covers transaction traces, service maps that draw your service dependencies, database query analysis, external service tracking, and code-level profiling. Distributed tracing traces requests across microservices and ties them to infrastructure metrics, logs, and errors in a single view.
Sentry tracing captures spans and transactions across services, with a trace explorer for slicing by attribute and an insights page for frontend and backend performance. It auto-detects performance issues like N+1 queries, slow database calls, and uncompressed assets, then ties each one back to the line of code and the commit that introduced it. What Sentry does not give you is a service map of your full architecture or correlation with host and container metrics.
Verdict: Pick New Relic if you need APM that maps services and connects to infrastructure. Pick Sentry if you want tracing that points straight to the slow query and the developer who wrote it.
New Relic vs Sentry: infrastructure and logs
New Relic covers both. Sentry covers logs only.
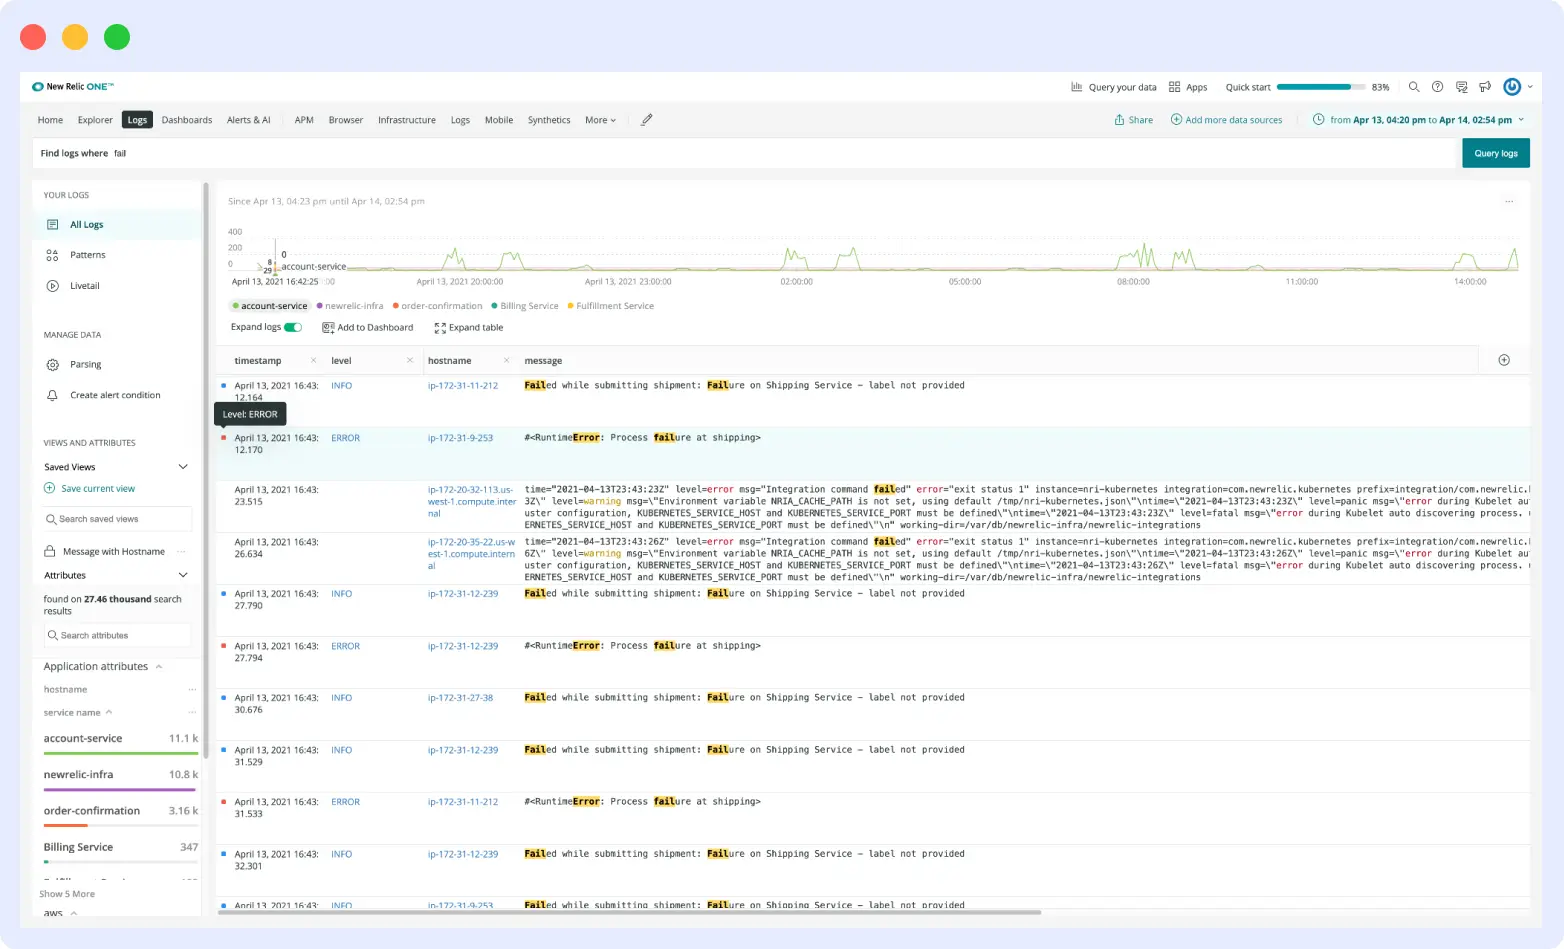
New Relic’s infrastructure agent collects metrics from hosts, containers, and Kubernetes clusters. It also ships with 780+ integrations for AWS, Azure, GCP, databases, and message queues. Log management ingests logs from any source and parses them automatically. Each log line ties back to the APM trace, error, or host that produced it.
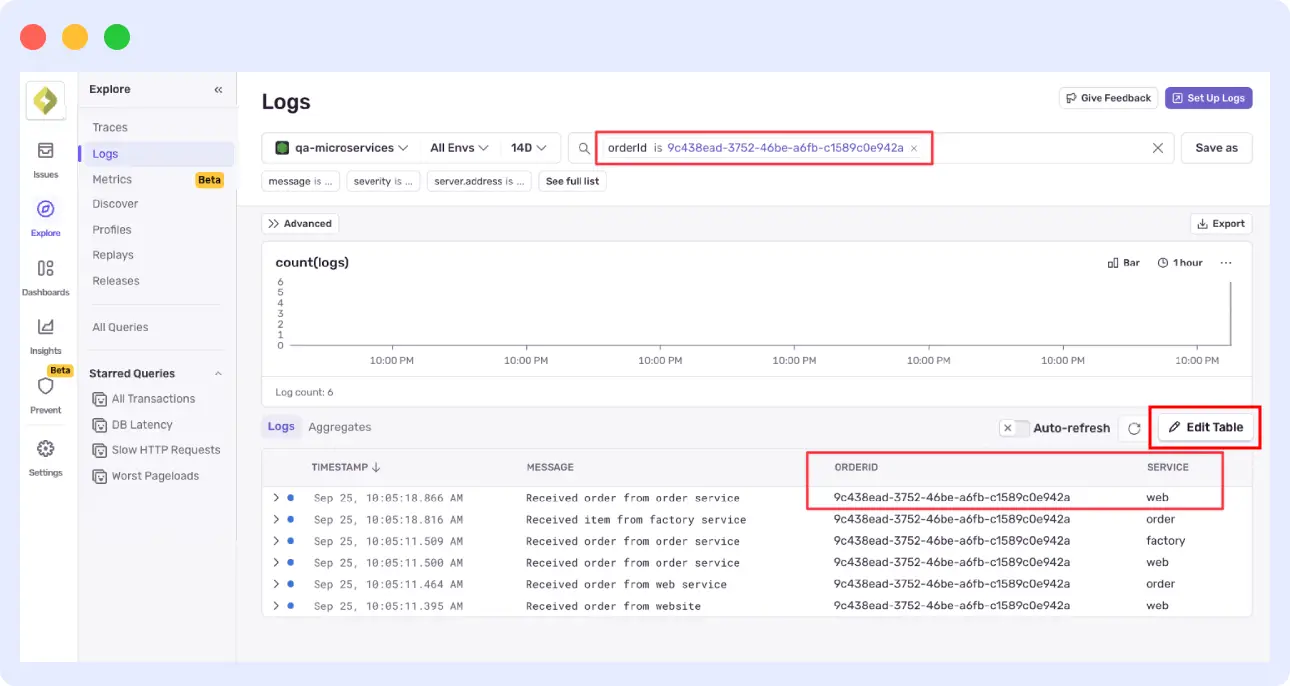
Sentry Logs are structured and trace-connected, tied to spans and errors in the same view. Pricing starts at 5 GB free per month, then $0.50/GB after that. Sentry has no infrastructure agent. If you need to monitor servers, containers, or Kubernetes, you need another tool.
Verdict: Pick New Relic if you need a single platform to monitor infrastructure and logs. Pick Sentry only if your logs are used to debug code and you already have something else handling infrastructure.
New Relic vs Sentry: alerting and noise management
New Relic offers more advanced alerting. Sentry keeps it simple.
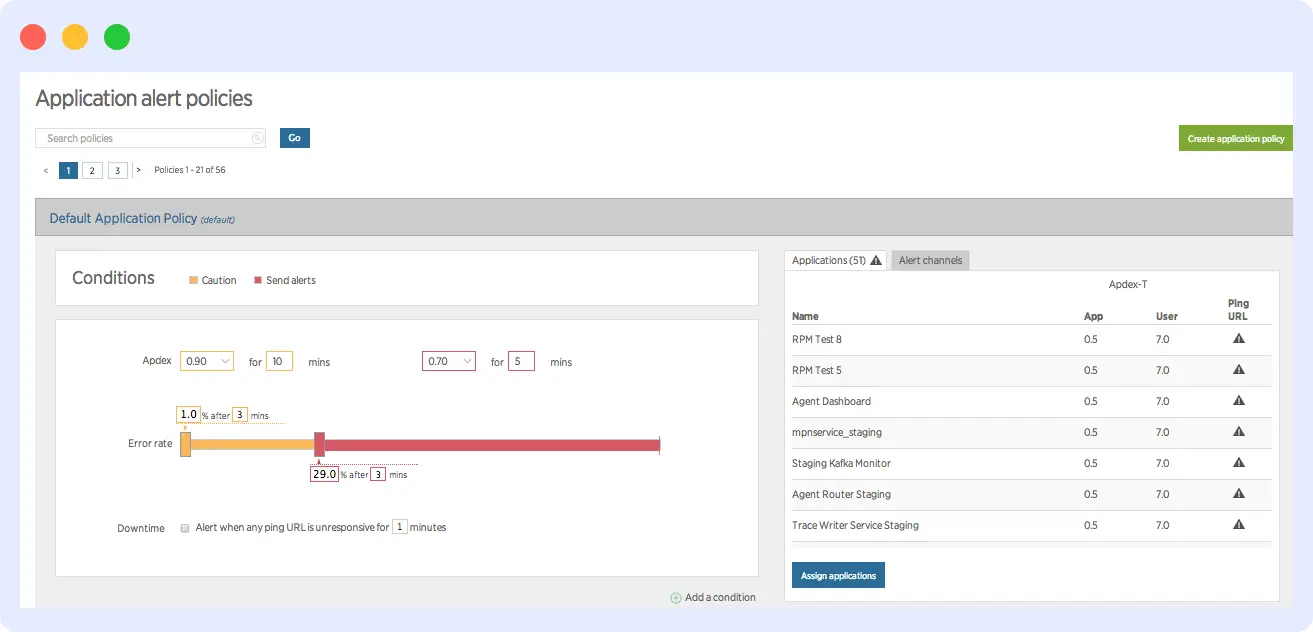
New Relic alerts cover static thresholds, anomaly detection with dynamic baselines, and AI-driven correlation that groups related incidents. When a cache layer fails, you get one issue instead of 20 alerts. New Relic also flags gaps in your stack’s alert coverage.
Sentry alerts come in three types: issue alerts, metric alerts, and uptime or cron alerts. You set conditions and route notifications to Slack, PagerDuty, or webhooks. Sentry groups errors by fingerprint, which cuts duplicate alerts. It does not correlate incidents across services or run anomaly detection on baselines.
Verdict: Pick New Relic if alert volume is the problem and you need AI to group related incidents. Pick Sentry if you want straightforward alerts on errors and performance.
New Relic vs Sentry: OpenTelemetry support
Both tools accept OpenTelemetry, but neither is OTel-native. Both lead with their own SDKs and treat OTel as a secondary path.
New Relic accepts OTLP for traces, metrics, and logs from any OpenTelemetry SDK or collector. OTel data lands in the same APM UI as data from New Relic’s own agents, with a normalization layer that maps OTel signals to New Relic’s APM views. New Relic also ships its own OTel collector distribution called NRDOT.
Sentry supports OTel through its exporter and SDK integrations, but the Sentry SDK is the supported path for tying errors, traces, and replays together. Generic OTel data does not auto-link to Sentry’s debugging features the way SDK data does.
Verdict: Pick New Relic if you’re already on OpenTelemetry and want a backend that ingests OTLP cleanly and maps it into APM views. Pick Sentry if you’re fine running its SDK as the main instrumentation. Neither tool is the right pick if avoiding proprietary instrumentation is your top priority.
New Relic vs Sentry: language and framework support
Sentry supports more languages out of the box. New Relic supports the major ones with deeper agent-level instrumentation.
Sentry SDKs cover 100+ languages and frameworks, including JavaScript (React, Vue, Angular, Next.js, Remix, Svelte), Python (Django, Flask, FastAPI), Java, Ruby on Rails, PHP (Laravel, Symfony), Go, .NET, Rust, Elixir, Dart/Flutter, iOS, Android, Unity, Unreal Engine, native C/C++, plus Xbox, PlayStation, and Nintendo Switch. Onboarding is fast: install the SDK, drop in your DSN, and errors start flowing in minutes.
New Relic APM agents cover 8 languages: Java, .NET, Node.js, Python, Ruby, PHP, Go, and a C SDK. The Java agent works with any JVM language including Scala, Kotlin, and Clojure. Each agent auto-instruments common frameworks and libraries on its language. For anything outside that list, you instrument with OpenTelemetry and ship to New Relic via OTLP. Onboarding takes longer than Sentry because each product (APM, infrastructure, browser, mobile) needs its own agent installed.
Verdict: Pick Sentry if you run a polyglot stack or build for game consoles, mobile, or niche runtimes. Pick New Relic if your stack runs on the languages it covers and you want deeper agent-level instrumentation than an SDK provides.
New Relic vs Sentry: developer workflow integrations
Sentry integrates more tightly with developer tools. New Relic focuses on incident management tools.
Sentry’s GitHub integration ties errors to specific commits, assigns the commit author, comments on pull requests with issues a PR might introduce, and automatically resolves issues when commit messages contain “fixes SENTRY-ID.” Jira integration syncs assignees, comments, and status both ways. Slack integration lets you assign and resolve issues from the notification thread.
New Relic integrations lean towards incident management and infrastructure: PagerDuty, ServiceNow, Opsgenie, Slack, and Microsoft Teams for routing alerts. New Relic does not tie errors to specific commits or comment on pull requests.
Verdict: Pick Sentry if your team works in GitHub, Jira, and Slack and you want errors to flow through the same tools as code review. Pick New Relic if your priority is routing incidents to PagerDuty or ServiceNow.
New Relic vs Sentry: pricing and data retention
New Relic charges by data ingested plus platform users. Sentry charges by event volume across separate product categories.
New Relic gives you 100 GB of free data ingestion per month, plus one full platform user. After that, data costs $0.40 per GB on the Original Data option or $0.60 per GB on Data Plus. Original Data retains most data types for at least 8 days, with logs at 30 days. Data Plus extends retention up to 90 days. The Standard tier caps full-platform users at 5 and charges $10 for the first, plus $99 for each additional. Pro removes the cap but jumps to $349 per user. Core users are $49 across tiers. The free tier is generous; the bills get unpredictable when data volume or user count grows. To know more about New Relic Pricing.
Sentry has four plans: Developer (free), Team ($26/month), Business ($80/month), and Enterprise (custom). Each plan includes set monthly volumes for errors, spans, replays, logs, attachments, and uptime or cron monitors. Errors are 5K on Developer and 50K on paid plans. Logs are 5 GB free, then $0.50 per GB. Spans cap at 5M, replays at 50, and you pay overage rates when you exceed plan limits or buy reserved volume in advance at lower rates. Errors retain for 30 days on Developer and 90 days on paid plans. Logs retain for 30 days across all plans.
Verdict: Pick New Relic if you want to start free and consolidate multiple monitoring tools into one bill. Pick Sentry if you want predictable costs tied to event volume and clear visibility into what each product category costs.
Can you use New Relic and Sentry together?
Yes, the two tools work together. New Relic handles infrastructure, APM, and logs across the stack. Sentry handles code-level errors, releases, and frontend or mobile debugging. The tools overlap on APM and error tracking, but each one is stronger in its own lane.
The split usually follows team roles. Platform and SRE teams use New Relic to watch hosts, Kubernetes clusters, service maps, and SLOs. Application developers use Sentry to triage errors tied to specific commits, watch session replays, and ship fixes. When an alert fires, an engineer checks both: New Relic shows the host CPU spike, and Sentry shows the exception that happened on the same release.
Running both makes sense for larger organizations with separate platforms and product teams, or for teams already on one tool that need the depth the other provides. It does not make sense for smaller teams. You end up paying twice for APM and error tracking, the monitoring stack is split between two teams, and someone has to manage both bills.
Final take: which should you pick?
The choice between New Relic and Sentry comes down to three things: your stack, your team, and your budget shape.
If your stack is mostly backend services, infrastructure, and Kubernetes, and you want a single tool to cover it all, pick New Relic. If your stack is frontend-heavy, mobile, or built around shipping code fast, pick Sentry. Mixed stacks usually lean toward New Relic for the platform side and Sentry for the application side.
If platform engineers and SREs run your monitoring, pick New Relic. If application developers do, pick Sentry. Whoever opens the tool every day should be the team it was built for.
On budget, the question is what kind of unpredictability you can live with. New Relic offers a generous free tier but bills you as data volume grows. Sentry gives you predictable monthly costs tied to event volume.
Middleware: a better alternative to New Relic and Sentry
If New Relic feels too expensive at scale and Sentry doesn’t cover enough of your stack, Middleware is worth a look. Middleware is a full-stack observability platform built OpenTelemetry-native, with APM, infrastructure, logs, metrics, traces, and RUM in one tool.
Middleware uses a single OTel-based agent for the entire stack, so you don’t run separate agents for APM, infrastructure, and browser, as you would with New Relic. Pricing is pay-as-you-go at $0.30 per GB for logs, metrics, and traces, with 30-day default retention. No per-host fees, no per-user fees, no plan-tier gating of features.
Middleware fits teams that want New Relic’s coverage without its bill, or teams running Sentry for errors that now need infrastructure and APM in the same view. It also includes OpsAI, an agent that surfaces root causes from telemetry data and can open pull requests with proposed fixes.
Try Middleware free with unlimited data for 14 days.
FAQ
What is the difference between New Relic and Sentry?
New Relic is a full-stack observability platform that monitors apps, infrastructure, Kubernetes, logs, browsers, and mobile in a single tool. Sentry is a developer-focused error tracking and APM tool designed to tie bugs back to specific commits and code authors. New Relic answers “Is the system healthy?” while Sentry answers “What broke, and who wrote it?”
Is Sentry an APM tool?
Yes, Sentry is an APM tool. Sentry started as an error tracker and has expanded into APM with distributed tracing, span metrics, and performance issue detection like N+1 queries and slow database calls. Its APM is narrower than New Relic’s, since Sentry does not monitor infrastructure or build full-service maps.
Does New Relic do error tracking?
Yes. New Relic Errors Inbox aggregates errors from APM, browser, mobile, serverless, and OpenTelemetry into one screen, with grouping by fingerprint, triage states, and Slack alerts.
Can you use New Relic and Sentry together?
Yes. You can run New Relic for infrastructure, APM, and logs, and Sentry for code-level error tracking and frontend or mobile debugging. Larger organizations often split by team role — SREs use New Relic, developers use Sentry.
Which is cheaper, New Relic or Sentry?
It depends on what you measure. New Relic is cheaper if your data volume is low and your team is small, since the free tier covers 100 GB and one full-platform user. Sentry is cheaper if you want predictable monthly costs tied to event volume rather than a bill that scales with data ingestion.
Is Sentry better for frontend apps?
Yes. Sentry has dedicated SDKs for React, Vue, Angular, Next.js, Remix, and Svelte with auto-instrumentation, source maps that de-minify JavaScript stack traces, and session replay tied to each error.