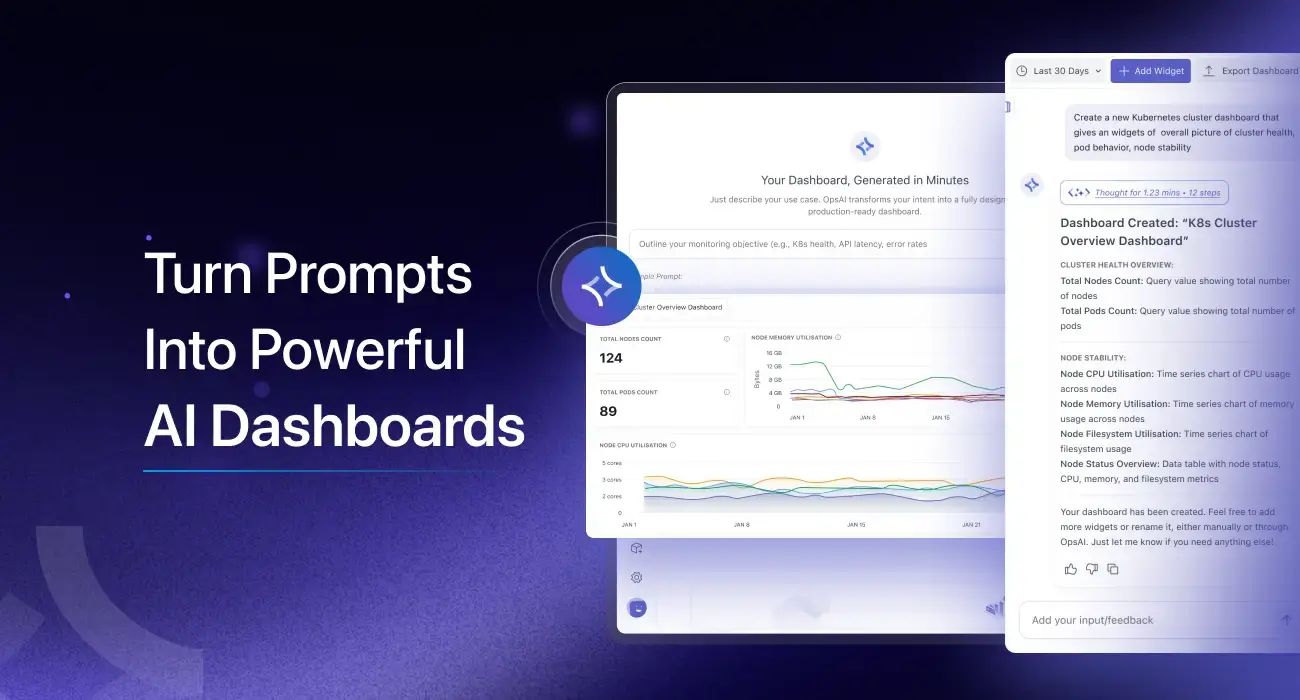
Full Dashboard from One Prompt
- Generate a full dashboard from a single prompt, with widgets placed automatically.
- Use it for common outcomes, such as logging activity and error behavior across services.
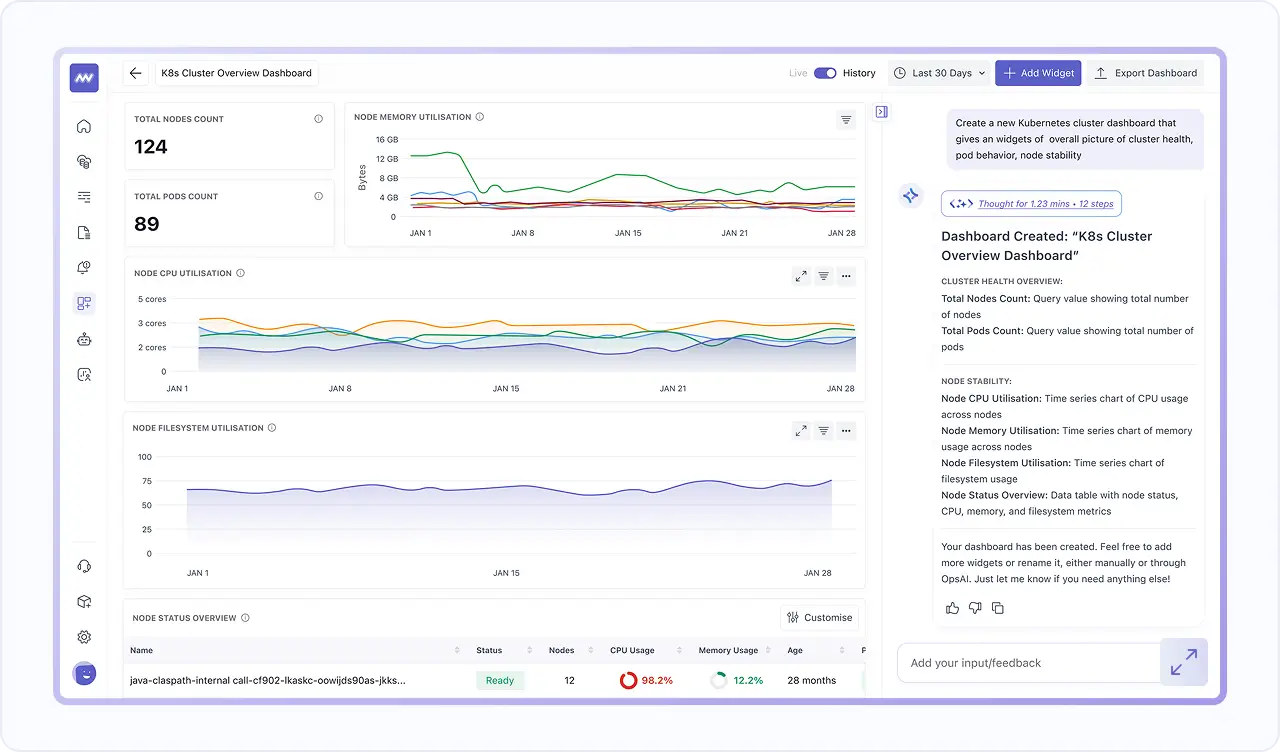
- Create environment-level views, such as a Kubernetes health overview across nodes, pods, CPU, memory, and network.
Add Widgets & Filter The Whole Dashboard
- Add a widget to an existing dashboard using the AI prompt panel.
- Filter the entire dashboard, not just one chart, using attributes like service.name, traceId etc.
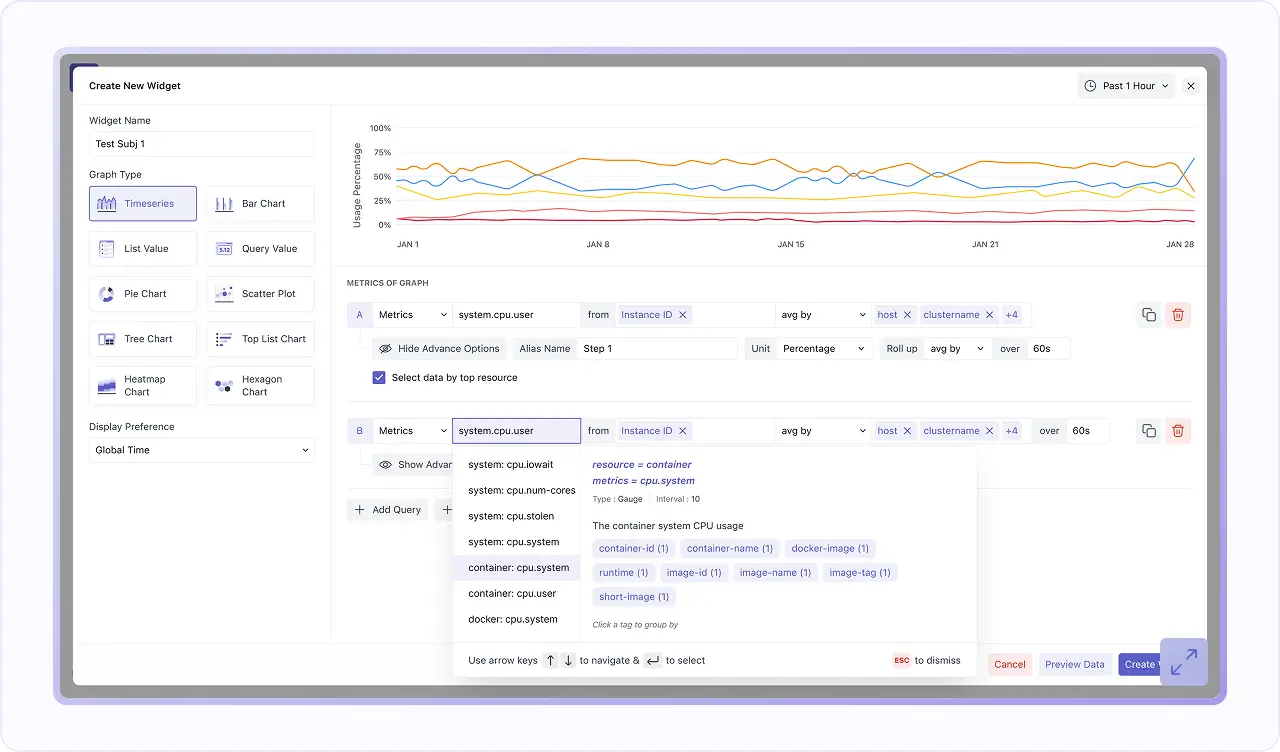
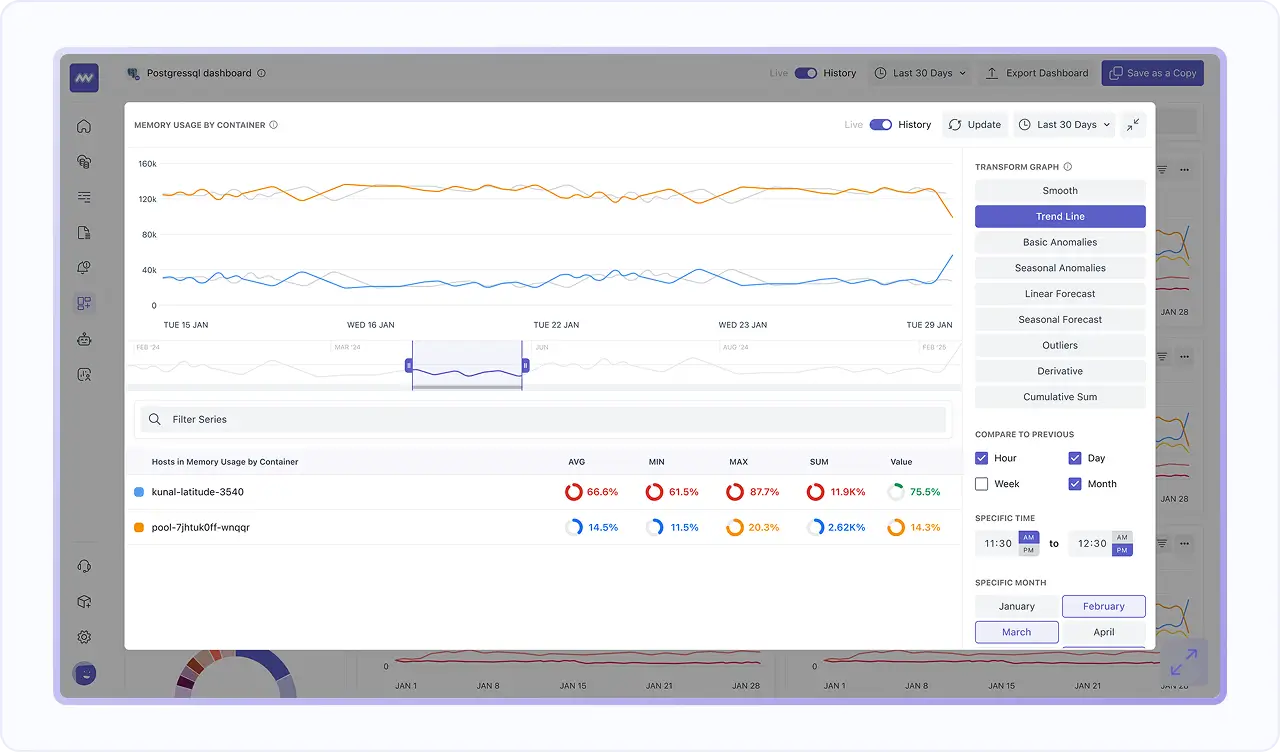
- Choose visuals & timeframes, build queries & formulas, tune rollups, apply advanced functions, and polish the layout in one streamlined, end-to-end widget creation workflow.
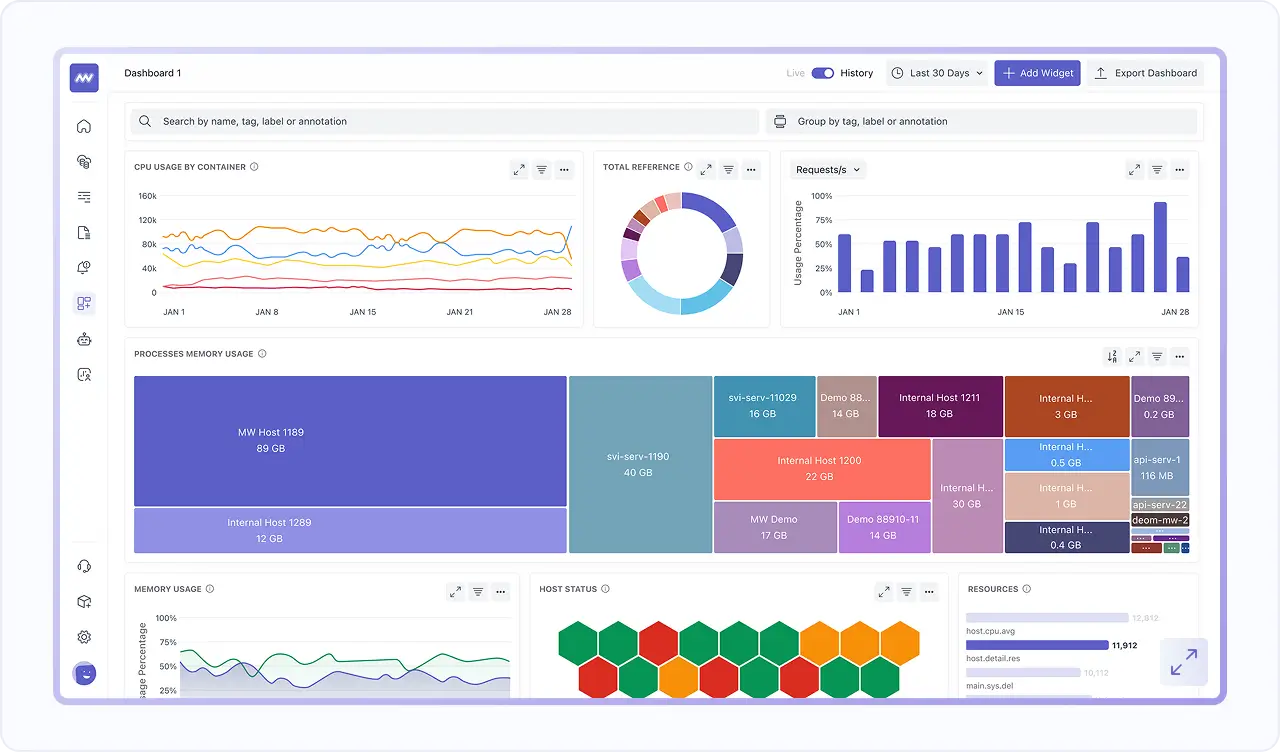
Pick The Best Chart for Every Signal
- Use Timeseries, Bar, List, Query Value, Pie, Scatter, Tree, Top List, Heatmap, and Hexagon charts based on what you want to understand.
- Keep dashboards readable for quick scanning while still supporting deep analysis when you drill into the same telemetry.
- Start from what you already instrumented, since default dashboards can populate automatically after Infra Agent and APM setup.
Jump from Spikes to Related Logs and Traces
- Logs include a trace ID that correlates the log to its related trace, so you can move from what happened to how the request flowed.
- See related logs alongside spans using Trace ID correlation, so debugging stays grounded in the request context.
- Use this flow to confirm scope, validate root cause, and act faster without switching tools.