ServiceNow discontinued Cloud Observability (Lightstep) on March 1, 2026, with no migration path or replacement. While some contracts may still have access, the platform no longer receives security updates, bug fixes, or support, creating compliance and reliability risks. If you’re already using OpenTelemetry (OTel), switching to a new platform is mostly a configuration change rather than a full re-instrumentation effort.
Note: Historical data does not migrate. Any traces, logs, and metrics stored in Lightstep will remain there, so export anything critical before access is lost.
What Was Lightstep? (And Why It Mattered)
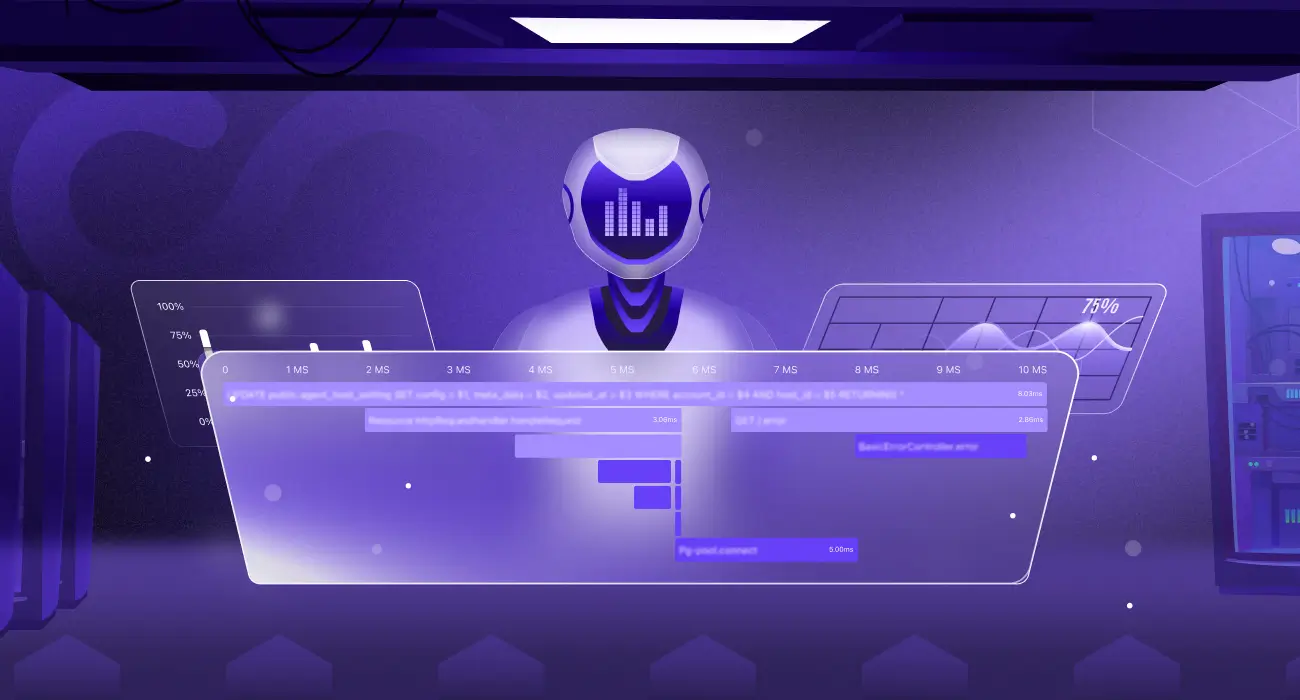
Lightstep was an observability platform built by engineers who originally designed distributed tracing at Google.
Its core capabilities included:
- Unified telemetry: Logs, metrics, and traces in a single interface
- OTel-native instrumentation: True OpenTelemetry compatibility
- Change intelligence: Linking performance issues to deployments
These features set the baseline for modern observability tools. Today’s platforms go further, with capabilities such as RUM, synthetic monitoring, AI-driven root cause analysis, and LLM observability.
This guide highlights the best Lightstep alternatives in 2026, focusing on OTel support, MELT coverage, pricing, and real-world migration effort.
The 9 Best Lightstep Alternatives in 2026
Here are the top Lightstep alternative platforms to consider in 2026, based on migration ease, feature depth, and overall value:
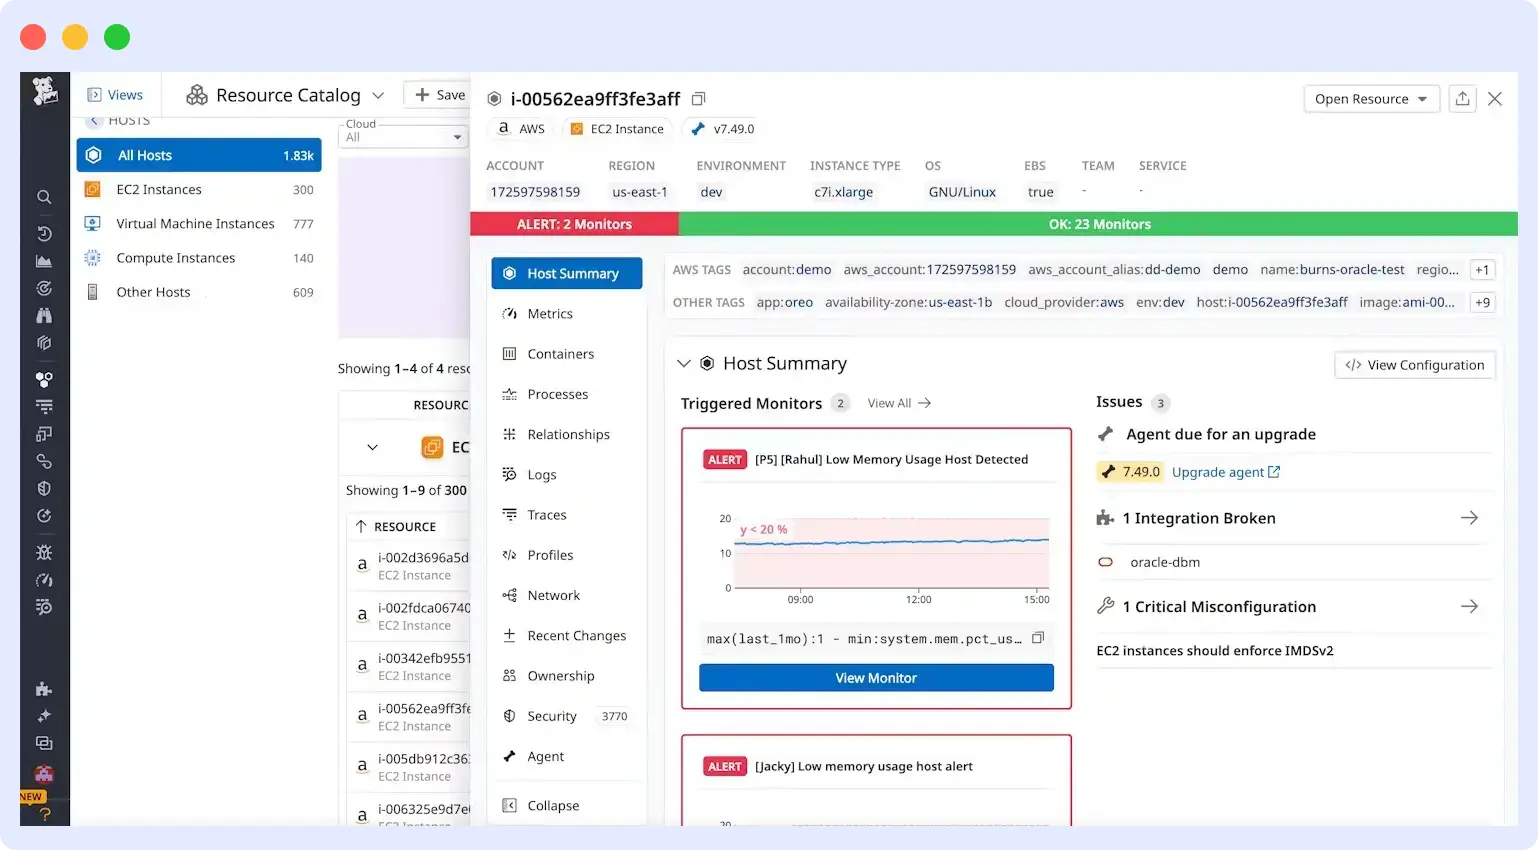
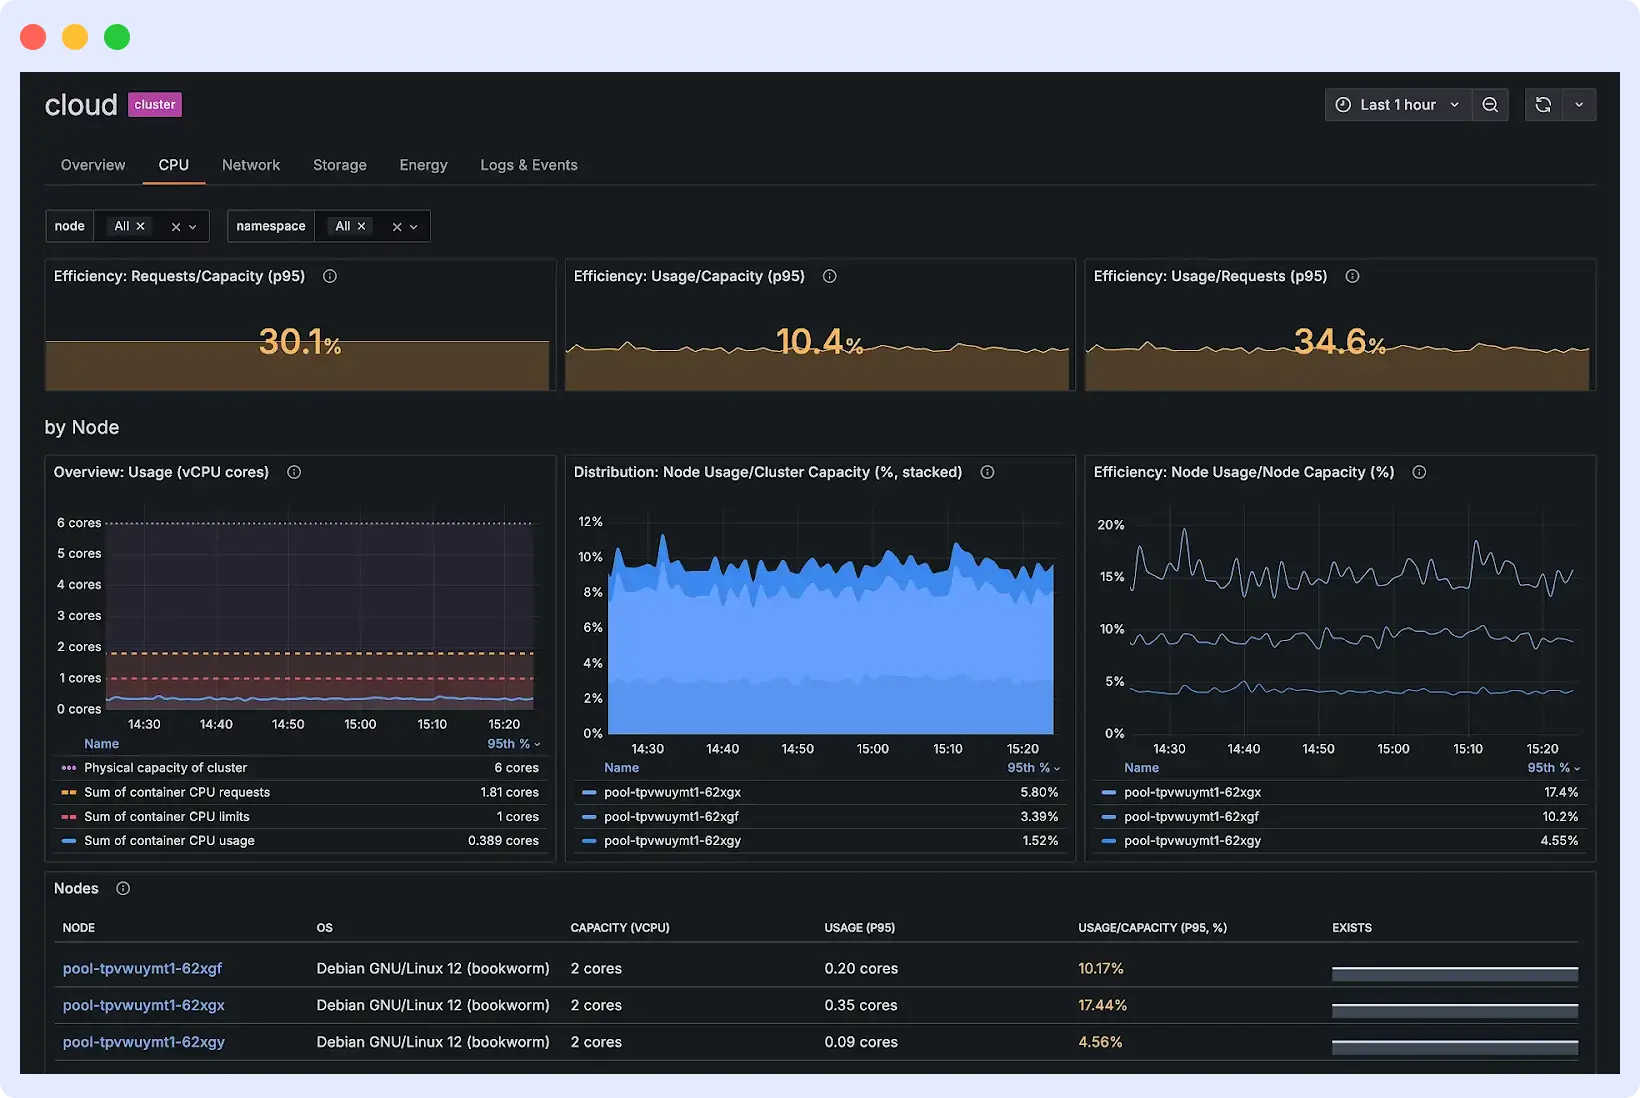
1. Middleware
Middleware is a full-stack observability platform built natively on OpenTelemetry. It covers metrics, events, logs, and traces (MELT) in a single system and extends well beyond what Lightstep offered: Real User Monitoring (RUM), synthetic monitoring, serverless tracing, database monitoring, and AI/LLM observability are all available within the same platform.
The AI component, OpsAI, performs root cause analysis and incident investigation directly inside the Middleware platform. Engineers can move from alert to cause without switching tools or writing manual queries.
Migration from Lightstep to Middleware
Middleware supports smooth migration from Lightstep if your services already use OpenTelemetry. Updating the OTLP exporter endpoint sends data seamlessly without changing instrumentation. Dashboards, alerts, and SLOs must be recreated in Middleware. Teams can run both systems in parallel to validate telemetry data before fully switching. Proprietary SDK users must move to OpenTelemetry first.
What you gain that Lightstep didn’t offer:
- Continue collecting telemetry without changing instrumentation
- Gain visibility into frontend performance through RUM, which Lightstep did not support
- Monitor synthetic transactions to detect issues before users experience them
- Trace serverless functions and database queries alongside application traces
- Reduce manual alert tuning with automated anomaly detection.
- Improve operational efficiency and incident response times without managing multiple tools.
The catch
Middleware is a newer platform compared to some long-standing observability vendors, and its integration ecosystem is still growing. That said, its core capabilities are solid and improving fast, and real-world adoption by customers like Hoichoi, Lee, and CEAT shows it is already being trusted in production environments.
Best for
Teams migrating from Lightstep who want full-stack observability with the lowest migration effort.
Pricing
Middleware offers usage-based pricing with no per-host or per-user fees, including a free tier for small teams, and charges $0.30/GB for telemetry beyond the free limit, with custom enterprise plans available.
OTel support: Native. Deployment: SaaS. Migration effort: Low.
2. Datadog
Datadog is an observability platform that combines infrastructure monitoring, APM, logs, RUM, synthetic monitoring, and security in a single interface. Aside from distributed tracing and unified telemetry that Lightstep offered, Datadog extends into enterprise-grade monitoring and a large integration ecosystem with 1000+ integrations across cloud providers, databases, CI/CD pipelines, and network systems.
Watchdog AI provides automated anomaly detection across metrics, traces, and logs without requiring manual threshold configuration.
Migration from Lightstep to Datadog
Datadog does not have to redirect OTel-native migration path. OTLP exporters are replaced rather than redirected, and you will need to switch to Datadog’s agent-based approach. Dashboards, alerts, and SLOs need to be recreated in Datadog’s interface. Teams on Lightstep’s proprietary SDK will need to re-instrument before switching.
Key Outcomes for Engineers
- Full-stack visibility across infrastructure, applications, and user experience
- 1000+ integrations without building custom data pipelines
- AI-powered anomaly detection via Watchdog
- Polished, highly customizable dashboards
The catch
Datadog is OTel-compatible, not OTel-native. OpenTelemetry data is converted internally, which can result in minor context loss and may affect how semantic conversions are stored. The Datadog pricing model also needs careful planning. Per-host charges, along with separate fees for APM, logs, custom metrics, and indexed spans, can make cost estimation more complex as usage scales.
Best For
Large enterprises with complex multi-cloud environments and no strict budget constraints.
Pricing
Pricing starts at $15/host/month for infrastructure monitoring. APM is billed separately, and additional charges apply for log management, custom metrics, and indexed spans.
OTel support: Compatible (data converted internally). Deployment: SaaS only. Migration effort: Medium.
3. Honeycomb
Honeycomb is the observability platform most philosophically aligned with what Lightstep was trying to achieve. It is OTel-native, ingests data directly via OTLP without converting it to a proprietary format, and centers its design on wide event spans that carry full context, including user IDs, request IDs, feature flags, and deployment metadata, all queryable at full cardinality.
BubbleUp, Honeycomb’s signature feature, automatically surfaces correlated attributes during incident investigation. Instead of manually narrowing down which dimension caused a latency spike, BubbleUp highlights the attributes that statistically distinguish slow requests from fast ones.
Migration from Lightstep to Honeycomb
Update the OTLP endpoint in your OpenTelemetry Collector configuration. Traces flow into Honeycomb without re-instrumentation. The main area to validate is infrastructure and metrics coverage. Honeycomb Metrics reached general availability recently, so running both platforms in parallel confirms coverage before switching.
What you gain
- High-cardinality attribute queries without performance tradeoffs
- BubbleUp for correlated root cause analysis
- Full event history without sampling or pre-aggregation
- Simple, transparent, event-based pricing
The catch
Honeycomb is SaaS-only, with no self-hosted deployment option. Organizations with data residency or compliance requirements must evaluate whether this fits their constraints. Honeycomb is trace and event-focused, so teams that rely heavily on traditional infrastructure dashboards will require some workflow adjustment.
Best for
Engineering teams focused on debugging high-cardinality distributed systems with minimal migration friction.
Pricing
Free tier includes 20M events/month. Paid plans start at $130/month, usage-based.
OTel support: Native. Deployment: SaaS only. Migration effort: Low.
4. SigNoz
SigNoz is an open-source observability platform built natively on OpenTelemetry. It unifies distributed tracing, log management, metrics, and SLO monitoring in a single application backed by ClickHouse, a columnar database that delivers high-performance analytical queries at scale.
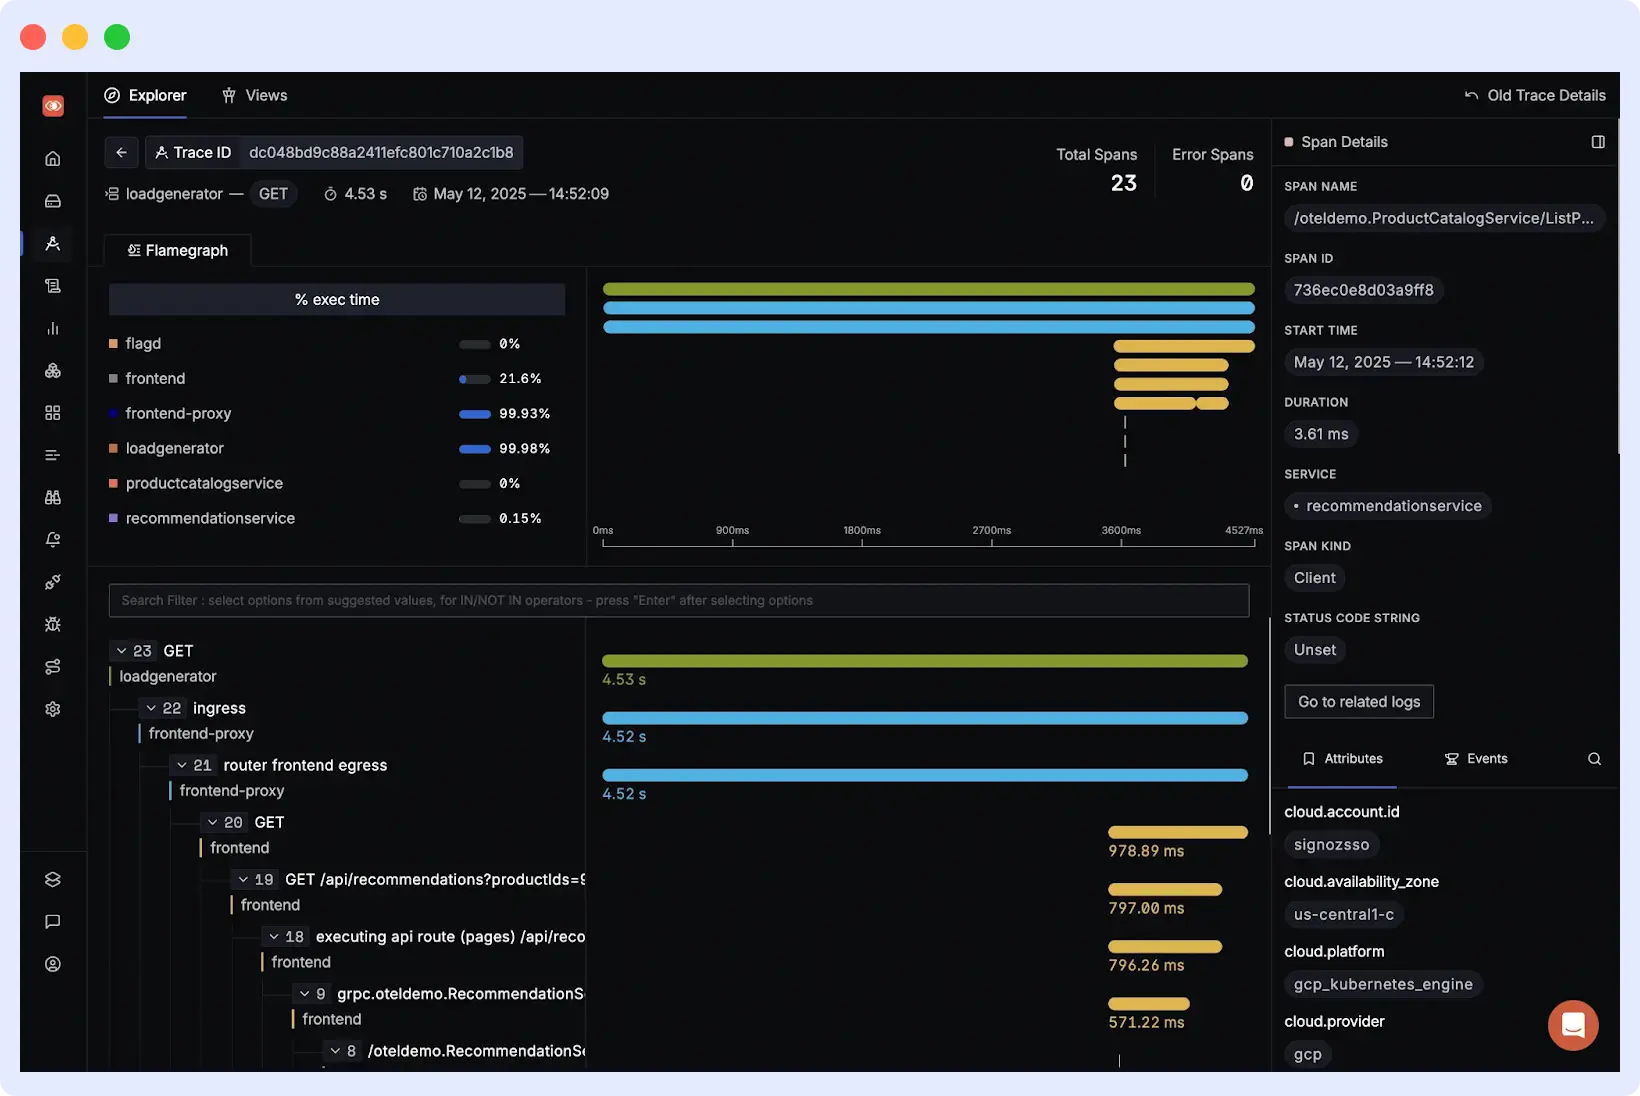
Because SigNoz is open-source, it is structurally harder to discontinue than a proprietary SaaS product, the exact type of vendor risk that surfaced with Lightstep’s EOL. The self-hosted version is free. SigNoz Cloud offers a managed option for teams that want OTel-native capabilities without the operational burden.
Migration from Lightstep to Signoz
If your services are already on OpenTelemetry, migration is a configuration change. Dashboards and alerts must be rebuilt. Run both platforms in parallel to validate telemetry before decommissioning Lightstep.
What you gain:
- Self-hosted deployment with full data ownership
- No per-host or per-user licensing
- High-performance queries on logs, metrics, and traces via ClickHouse
- Open-source codebase with an active escape hatch from vendor lock-in
The catch
Self-hosting requires operational investment ClickHouse tuning, capacity planning, and version upgrades. The integration ecosystem is smaller than established vendors. Verify coverage for specific components before committing.
Best for
Teams that want OTel-native observability with the option to self-host and full control over their data.
Pricing
Self-hosted is free. SigNoz Cloud starts at $49/month, usage-based.
OTel support: Native. Deployment: Self-hosted or SaaS. Migration effort: Low.
5. New Relic
New Relic is a full-stack observability platform covering APM, infrastructure, logs, distributed tracing, RUM, synthetic monitoring, and Kubernetes monitoring. It has deep APM capabilities with code-level diagnostics and transaction tracing that show engineers exactly where code is slow and where errors come from.
New Relic replaces Lightstep’s use cases, such as distributed tracing, unified MELT, and SLO tracking. New Relic also includes 100 GB free data ingest per month, which provides a practical way to validate a migration before committing to a paid plan.
Migration from Lightstep
Update the OTLP exporter endpoint. New Relic accepts OTel data natively, so instrumentation carries over. However, New Relic is OTel-compatible, not OTel-native it converts incoming OTel telemetry into its internal data format, which means querying happens through NRQL (New Relic Query Language) rather than OTel-native tooling. Some OTel labels and semantic conventions may not carry over cleanly.
Key Outcomes for Engineers
- Carry over OTel instrumentation without application code changes, with querying through a unified interface
- Use code-level transaction traces to identify slow execution paths
- Monitor Kubernetes clusters, infrastructure, and application performance from a single platform
- Validate the migration using the free tier before committing to the budget
The catch
Costs scale unpredictably for large teams. Per-user fees for full platform access can become significant at scale. New Relic has documented billing incidents in which agent-generated logs caused unexpected cost spikes. Treat the free tier as an evaluation vehicle, not a long-term production plan.
Best for
Teams that need deep APM capabilities and want a flexible evaluation path through a generous free tier.
Pricing
New Relic pricing includes 100 GB free data ingest per month, then $0.40/GB. One full platform user included free; additional users start at $99/month on the Standard plan.
OTel support: Compatible (data converted internally). Deployment: SaaS. Migration effort: Medium.
6. Grafana Stack (LGTM)
The Grafana Stack is a composable set of open-source projects: Loki for logs, Grafana for visualization, Tempo for distributed traces, and Mimir for long-term metrics storage. Together, they are often called the LGTM stack. Each component is independently scalable, open-source, and vendor-neutral. Grafana Cloud provides a managed version for teams that want the ecosystem without the operational overhead.
Migration from Lightstep to Grafana
The OpenTelemetry Collector requires separate exporters configured for Tempo (traces), Mimir (metrics), and Loki (logs), each with its own ingestion and retention settings. Correlating traces to related logs and metrics requires manual configuration in Grafana rather than being available out of the box. Dashboards and alerts must be rebuilt.
Key Outcomes for Engineers
- Retain full ownership of telemetry data with no vendor lock-in
- Scale logs, traces, and metrics independently based on ingest volume
- Build highly customized dashboards using Grafana’s visualization layer
- Eliminate per-host or per-GB licensing costs through self-hosting
- Use Grafana Cloud as a managed option if operational load becomes a constraint
The catch
Running four separate distributed systems introduces real operational complexity. Each component requires its own monitoring, capacity planning, and upgrade management. Correlating signals across the stack requires configuration work that a unified platform handles automatically. The engineering time this takes is a real cost that does not appear in pricing comparisons. Grafana Cloud’s usage-based pricing can also lead to unexpected bills for high-volume environments.
Best for
Teams with strong DevOps capacity who want full control over their observability pipeline and no vendor lock-in.
Pricing
Self-hosted is free beyond infrastructure costs. Grafana Cloud starts at $19/month with a limited free tier.
OTel support: Native. Deployment: Self-hosted or SaaS. Migration effort: High.
7. Dynatrace
Dynatrace is an enterprise-grade observability and security platform distinguished by its Davis AI engine, which automatically identifies application dependencies, detects anomalies, and provides precise root cause analysis without manual threshold configuration. Its OneAgent technology provides zero-touch deployment with automatic discovery of all application and infrastructure components.
Dynatrace is the right tool when the priority is automation over control teams that want answers delivered rather than investigation workflows.
Migration from Lightstep to Dynatrace
Dynatrace supports OpenTelemetry, but its primary value comes from the proprietary OneAgent. Teams migrating from Lightstep will typically replace OTel-based instrumentation with OneAgent, which handles auto-discovery automatically. Dashboards and alerts must be rebuilt.
What you gain:
- Automated root cause analysis via Davis AI (significantly reduces MTTR)
- Real-time dependency topology map
- PurePath tracing for end-to-end transaction context
- Automated discovery of new services without manual instrumentation changes
The catch
Dynatrace is very expensive and sized for large enterprise budgets. The platform can feel like a black box. Davis AI provides answers, but engineers who want to understand the underlying data model encounter steep learning curves and inconsistent documentation. Despite OTel support, the proprietary OneAgent creates significant vendor lock-in.
Pricing
Enterprise pricing, typically per host.
Best for
Large enterprises with complex hybrid-cloud environments seeking AI-automated discovery, dependency mapping, and root-cause analysis.
OTel support: Compatible. Deployment: SaaS or managed. Migration effort: Medium-High.
8. Splunk Observability Cloud
Splunk Observability Cloud unifies APM, infrastructure monitoring, RUM, and synthetic monitoring with a direct bridge to Splunk’s industry-leading log analytics platform via Log Observer Connect. This means traces and metrics live in Splunk Observability Cloud while logs stay in the Splunk platform, correlated without duplicate ingestion. Full-Fidelity Tracing captures 100% of trace data without sampling.
Migration from Lightstep Splunk
Splunk Observability Cloud is OTel-native. Existing OTLP instrumentation carries over by updating the exporter endpoint. Dashboards and alerts must be rebuilt.
What you gain:
- Seamless correlation between traces/metrics and deep Splunk log analytics
- 100% trace capture with NoSample™ Full-Fidelity Tracing
- Tight integration with existing Splunk SIEM and security investments
The catch
Splunk is notoriously expensive. For organizations without an existing Splunk investment, the architecture with two separate data backends for logs versus traces/metrics adds complexity compared to truly unified platforms. Without the Splunk platform already in place, Splunk Observability Cloud loses its primary differentiator.
Best for
Organizations are already invested in the Splunk ecosystem for log management and security.
Pricing
Premium enterprise pricing. Contact for quotes.
OTel support: Native. Deployment: SaaS. Migration effort: Medium.
9. Elastic Observability
Elastic Observability is a full-stack observability platform built on the Elastic Stack, using Elasticsearch for search and analytics across logs, metrics, and traces. It handles distributed tracing and unified telemetry, and adds log analytics, RUM, synthetic monitoring, and SLO tracking beyond what Lightstep offered.
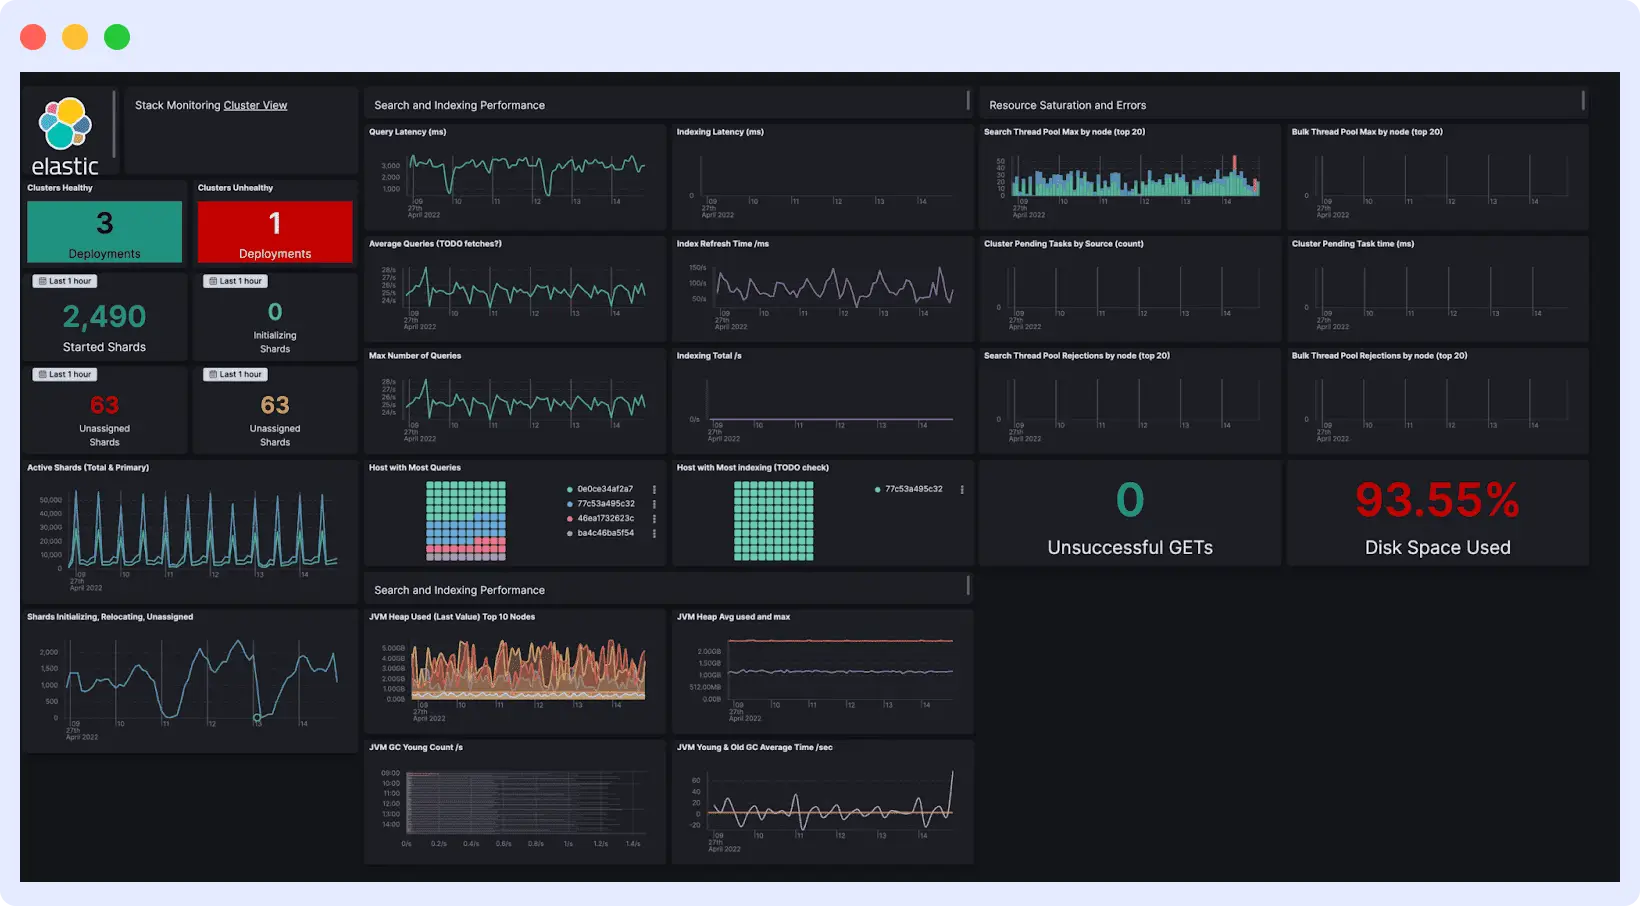
The log analytics layer is where it pulls ahead of most tools, with ES|QL, Elasticsearch’s own query language, enabling flexible searches across large log datasets that most observability platforms cannot match.
Migration from Lightstep to ElasticSearch
Your existing OTel instrumentation works with Elastic via the Elastic Distributions of OpenTelemetry (EDOT), so no agent replacement is needed. The migration work sits in the setup, not the instrumentation. Self-hosting requires knowledge of cluster sizing, index management, and performance tuning. Elastic Cloud and serverless options cut down that operational work significantly.
Key Outcomes for Engineers
- Carry over OTel instrumentation using EDOT without modification
- Perform ad hoc log analysis at scale using ES|QL
- Choose between self-managed, hosted, or serverless deployment models
- Use 400+ integrations for infrastructure monitoring
- Track SLOs alongside supporting telemetry data
The catch
Self-hosting Elastic at scale requires ongoing operational investment, including cluster management and tuning. Pricing across ingest, storage, and feature tiers can require iteration to model accurately. Some advanced features, including AI-assisted capabilities, may require additional configuration before delivering consistent value.
Best for
Teams with log-heavy workloads or existing investments that need strong analytics alongside observability.
Pricing
Elastic Cloud pricing starts at $99/month on the Standard plan, with usage-based billing across ingest, storage, and search. Self-managed deployments are free beyond infrastructure costs.
Lightstep Alternatives: Side-by-Side Comparison
Choosing the right alternative depends on your specific requirements, whether it’s OpenTelemetry support, pricing flexibility, or advanced analytics. The table below compares the top Lightstep alternatives across key factors to help you decide faster.
| Tool | OTel Support | Free Tier | Self-Hosted | Migration Effort | Best For |
| Middleware | Native | Yes (100 GB/month) | No | Low | Full-stack migration from Lightstep |
| SigNoz | Native | Yes (self-hosted) | Yes | Low | Data ownership, open-source |
| Honeycomb | Native | Yes (20M events/month) | No | Low | High-cardinality tracing |
| Grafana LGTM | Native | Yes (limited) | Yes | High | Data control, visualization |
| New Relic | Compatible | Yes (100 GB/month) | No | Medium | Deep APM, free evaluation |
| Datadog | Compatible | No | No | Medium | Enterprise breadth |
| Dynatrace | Compatible | No | No | Medium-High | AI-automated enterprise observability |
| Splunk | Native | No | No | Medium | Existing Splunk users |
| Elastic | Native (EDOT) | Yes (self-managed) | Yes | Medium | Log-heavy workloads |
How to Evaluate a ServiceNow (Lightstep) Alternative
Not all observability platforms are equivalent. Before trialing anything, every tool should pass these five checks.
1. OTel-native vs OTel-compatible
“Native” means the tool is built around OpenTelemetry from scratch with no proprietary agent and no data translation layer. “Compatible” means it accepts OTel data but converts it internally, which can strip context and lose semantic conventions.
2. Predictable pricing
Observability costs tend to balloon unpredictably. Watch for per-host charges, per-user fees, and custom metrics surcharges. These are the three billing vectors that cause “bill shock.” Look for usage-based pricing models you can model before signing anything.
3. Deployment flexibility
SaaS-only works for most teams. If your organization operates in a regulated industry (healthcare, finance, government) or has data residency requirements, you need a platform that supports self-hosted or hybrid deployment. Confirm this before starting a trial.
4. Vendor stability
The reason you are doing this migration is because a vendor shut down on you. Before committing to a replacement, check how long the product has existed, who funds it, whether it is backed by open-source code, and whether the company has a clear revenue model. Open-source projects with commercial offerings are harder to simply discontinue than proprietary SaaS products.
5. Cardinality handling
If your spans carry user IDs, session IDs, request IDs, or any high-volume attribute, confirm the platform handles high cardinality without throttling you or inflating your bill. Some platforms penalize high-cardinality data by treating it as “custom metrics.”
How to Migrate from Lightstep: Step-by-Step
If your services already use OpenTelemetry, migration is primarily a configuration change. Here is the complete process.
Step 1: Audit your current instrumentation. Determine whether your applications are instrumented with Lightstep’s proprietary SDK or OpenTelemetry. Run this check across every service in your stack. OTel-instrumented services can migrate by updating the OTLP exporter endpoint. Services on the Lightstep proprietary SDK require re-instrumentation first; budget time for this.
Step 2: Export and document everything before the platform goes dark. Screenshot your dashboards. Record every alert configuration, threshold, and notification channel. Save any custom queries or saved searches. You will not be able to export this programmatically once the platform is fully discontinued. Do this now, not after you have chosen a replacement.
Step 3: Set up your replacement platform. Configure your OpenTelemetry Collector to send data to the new platform. For most platforms, this means updating the exporters block in your Collector’s config.yaml with the new endpoint and authentication token.
Step 4: Run both platforms in parallel. Send telemetry to both Lightstep and your new platform simultaneously for a validation period, typically one to two weeks. Confirm that the new platform is capturing all the signals you expect: traces, metrics, and logs. Validate that alert conditions fire correctly. Do not cut over until you have confirmed parity.
Step 5: Cut over and decommission Lightstep. Once telemetry parity is confirmed, switch fully to your new platform and stop sending data to Lightstep. Do not leave the parallel setup running longer than necessary. Lightstep is running without security patches, so every additional day of usage increases your exposure.
Quick Decision Guide
Use this to narrow your choice quickly based on your situation.
You need the easiest possible migration with full-stack coverage: Start with Middleware. OTel-native, dedicated migration guide from Lightstep, and adds RUM and AI observability that Lightstep never had.
Data ownership and vendor lock-in are your primary concerns: Use SigNoz. Open-source, self-hostable, OTel-native, and structurally harder to discontinue than proprietary SaaS.
Your use case is primarily high-cardinality distributed tracing: Use Honeycomb. BubbleUp and wide events make it the closest philosophical successor to what Lightstep was trying to build.
You are a large enterprise with existing tool investments and a substantial observability budget: Evaluate Datadog or Dynatrace. Datadog if you need breadth and integrations. Dynatrace, if you need AI-automated root cause analysis with minimal manual configuration.
Your team has strong DevOps capacity and wants zero vendor lock-in: Use the Grafana LGTM stack. Maximum control, maximum operational effort.
You already run Splunk for logs and SIEM: Use Splunk Observability Cloud. Log Observer Connect makes it the logical extension of your existing investment.
Your primary bottleneck is log analytics: Use Elastic Observability. Elasticsearch-powered log search is genuinely best-in-class.
FAQs
Is ServiceNow Cloud Observability (Lightstep) completely shut down?
Yes. ServiceNow ended support on March 1, 2026 with no replacement and no migration path provided. If you’re still on it, you’re running on a dead platform with no security patches.
What’s the difference between OTel-native and OTel-compatible?
Native means the tool is built around OpenTelemetry from scratch, no proprietary agent, no data translation. Compatible means it accepts OTel data but converts it to its own internal format, which can strip context along the way.
How long does it take to migrate from Lightstep?
Depends on your instrumentation. If you’re already on OTel, it can be as fast as pointing your OTLP exporter at a new endpoint. If you’re on Lightstep’s proprietary SDK, you’ll need to re-instrument, which takes longer.
Can I keep using Lightstep after March 1, 2026?
Technically yes, but you shouldn’t. No patches, no bug fixes, no support. Any vulnerabilities discovered after the EOL date go unaddressed, which is a real risk especially in regulated environments.
Is Middleware a good replacement for Lightstep?
Yes. It covers everything Lightstep did, it’s OTel-native, and it has a dedicated migration guide for teams coming off ServiceNow Cloud Observability. You can start on the free tier and migrate without touching your existing OTel instrumentation.