Summary: Observability has become essential for organizations running complex cloud-native systems. Yet many teams still confuse it with monitoring or treat it as just another tooling layer. This guide explains what observability really means, why it matters, and how modern engineering teams use it to build reliable, scalable systems.
Key Takeaways
- Observability helps teams understand system behavior using logs, metrics, and traces.
- It explains why incidents happen, not just when.
- AI-driven observability is becoming standard for cloud-native teams
- Unified telemetry significantly reduces mean time to resolution (MTTR).
What is Observability?
Observability is the engineering capability to infer a system’s internal state based on the telemetry it produces, including logs, metrics, traces, events, and increasingly, continuous profiles.
Unlike traditional monitoring, observability allows engineers to ask new questions about system behavior without shipping new code. Instead of guessing where failures originate, teams get a real-time, data-backed view of what is happening across their infrastructure.
In modern distributed architectures spanning microservices, containers, serverless, and multi-cloud, outages rarely happen because teams lack talent. They happen because teams lack visibility.
“The proliferation of microservices and distributed systems has made it harder to understand real-time system behavior a critical requirement for troubleshooting problems.”
Laduram Vishnoi, Founder and CEO of Middleware.
Did you know developers spend nearly 50% of their time debugging? Much of this effort stems from fragmented tooling and incomplete telemetry.
Observability solves this by transforming raw data into actionable insight, enabling teams to detect anomalies early, identify root causes faster, and maintain system reliability at scale.
Observability combines practices and tools that help you:
- Monitor system performance end-to-end
- Debug applications and infrastructure efficiently
- Detect anomalies before they cause downtime
- Align reliability with CI/CD pipeline processes
Ultimately, observability empowers engineering teams to build resilient systems that support business growth.
A Brief History of Observability
Although it may feel modern, observability originates in control theory.
Early Foundations
Scientists inferred internal system behavior using external signals, a principle that still defines observability today.
1990s: Siloed Monitoring
As internet infrastructure grew, organizations deployed separate tools for servers, networks, and uptime, creating fragmented visibility.
2000s: Application Performance Monitoring (APM)
Tools like AppDynamics and Dynatrace introduced transaction-level visibility, shifting focus from infrastructure to application performance.
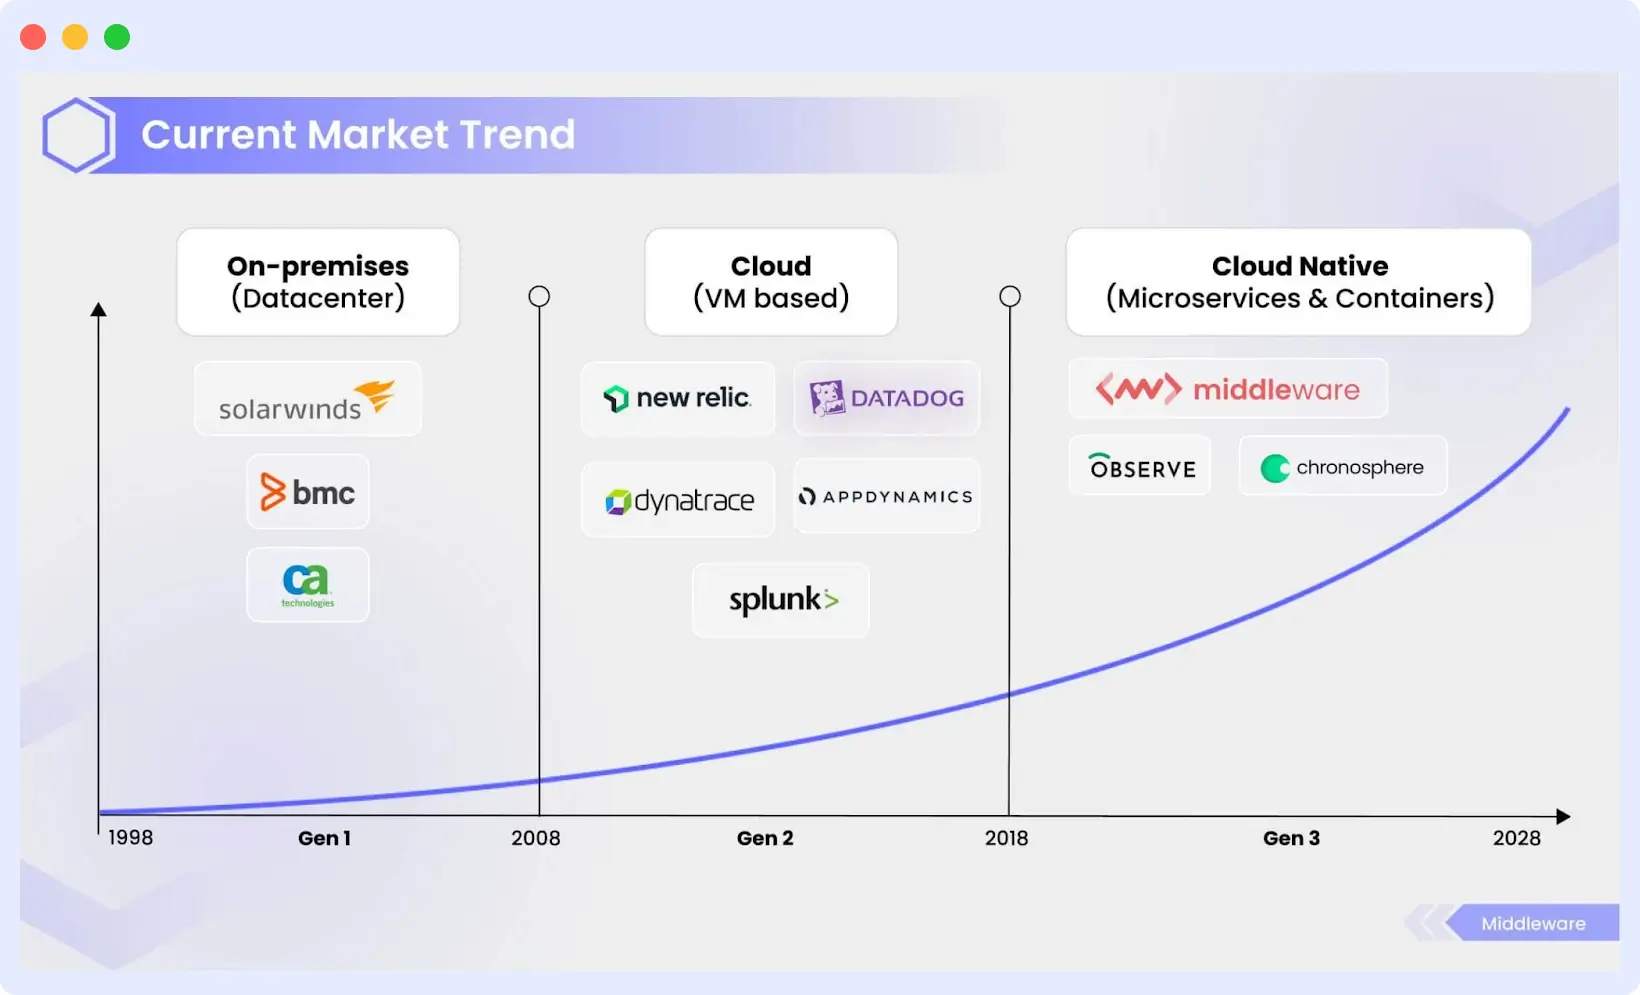
2010s: Cloud-Native Complexity
The cloud accelerated architectural sprawl.
- AWS and Azure launched native tooling
- Datadog unified logs, metrics, and traces
- Prometheus democratized telemetry
“Each decade has transformed how observability is expected to function from on-prem to cloud to cloud-native.”
Laduram Vishnoi, Founder and CEO of Middleware.
Today: AI-Assisted Observability
Modern platforms increasingly use AI to automate anomaly detection and root cause analysis.
“Across high-performing engineering organizations, observability maturity strongly correlates with faster deployment cycles and shorter incident recovery times.”
How Does Observability Work?
Observability operates on three pillars: logs, metrics, and traces. By collecting and analyzing these elements, you can bridge the gap between understanding ‘what’ is happening within your cloud infrastructure or applications and ‘why’ it’s happening.
With this insight, engineers can quickly spot and resolve problems in real-time. Observability operates on four primary telemetry signals.
1. Logs
Logs are records of each individual event that happens within an application during a particular period, with a timestamp to indicate when the event occurred. They help reveal unusual behaviors of components in a microservices architecture.
- Plain text: Common and unstructured.
- Structured: Formatted in JSON.
- Binary: Used for replication, recovery, and system journaling.
Cloud-native components emit these log types, leading to potential noise. Observability transforms this data into actionable information.
Start collecting and monitoring logs from any environment in 60 seconds. Get started!
2. Metrics
Metrics are numerical values describing service or component behavior over time. They include timestamps, names, and values, providing easy query ability and storage optimization.
Metrics offer a comprehensive overview of system health and performance across your infrastructure.
However, metrics have limitations. Though they indicate breaches, they do not shed light on underlying causes.
3. Traces
Traces follow a request’s journey through a distributed system, from start to finish. Each trace logs the interactions between services and components, making it easier to:
- Identify latency issues
- Pinpoint bottlenecks
- Understand service dependencies
They help analyze request flows and operations encoded with microservices data, identify services causing issues, ensure quick resolutions, and suggest areas for improvement.
4. Continuous Profiling (The Emerging Signal)
Continuous profiling provides real-time visibility into CPU usage, memory allocation, and code-level performance, helping teams detect inefficiencies before they escalate into production incidents.
This allows engineering teams to answer critical questions such as:
- Which functions are consuming the most CPU?
- Where is memory being allocated or leaked?
- Which code paths are slowing down requests under real production load?
By correlating profiling data with logs, metrics, and traces, teams can move beyond symptom-based debugging and pinpoint performance issues down to the exact line of code.
Modern observability platforms increasingly treat continuous profiling as the fourth core telemetry signal, alongside logs, metrics, and traces, especially for cloud-native and high-scale systems.
👉 To learn more about how continuous profiling works and why it’s becoming essential, read our detailed guide on Continuous Profiling.
Unified observability
The real power emerges when telemetry is consolidated into a single platform. Successful observability stems from integrating logs, metrics, and traces into a holistic solution.
Rather than using separate tools, unifying these pillars helps developers better understand issues and their root causes.
According to recent studies, companies with unified telemetry data can expect a faster Mean time to detect (MTTD) and Mean time to respond (MTTR) and fewer high-business-impact outages than those with siloed data.
Observability vs Monitoring
Monitoring tells you something broke.
Observability tells you why it broke.
Traditional cloud monitoring relies on dashboards and predefined metrics to show system health and alert teams when thresholds are breached. While monitoring is effective at identifying what is happening, it often fails to explain why it’s happening.
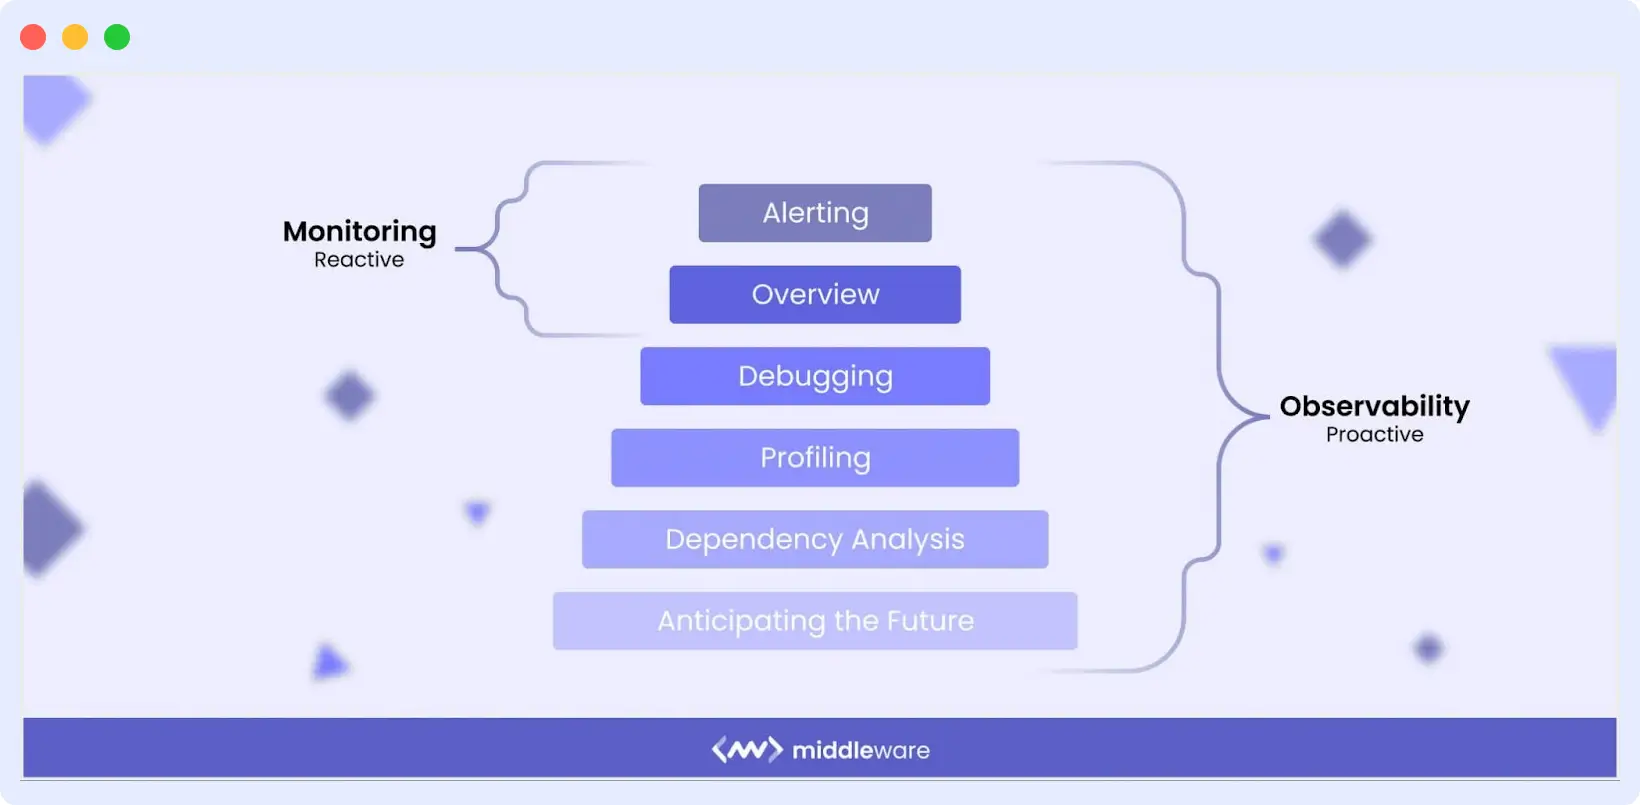
Observability goes deeper by correlating logs, metrics, and traces across the entire infrastructure. Instead of isolated signals, teams gain a unified, real-time view of system behavior, enabling them to detect issues early, understand their root causes, and prevent incidents from escalating.
Nearly 64% of organizations report at least a 25% MTTR improvement after adopting observability practices.
👉 Explore our detailed guide on Observability vs Monitoring to learn more.
Why is Observability Important For Business?
Why Observability Matters for Modern Businesses
Over 90%of enterprises now operate multi-cloud environments, dramatically increasing operational complexity.
While these scalable systems bring immense benefits, they also introduce new challenges in monitoring and management, including:
- Outdated tools: Traditional monitoring solutions simply can’t keep up with modern, distributed architectures.
- Limited visibility: Legacy systems create silos, making it difficult to manage processes or automate effectively.
- Vendor lock-in: Switching from one proprietary tool to another used to be tedious, but observability platforms with vendor-agnostic data formats make data portability much easier.
- High costs: In some cases, legacy monitoring platforms cost more than the cloud infrastructure itself.
It’s no surprise that DevOps and SRE teams are increasingly adopting observability to understand system behavior better, troubleshoot issues faster, and optimize performance. In fact, the growing reliance on observability platforms is expected to push the market to USD 4.1 billion by 2028.
The Benefits of Observability
Observability has evolved from a technical capability into a strategic business advantage. As distributed systems grow more complex, organizations rely on observability to maintain reliability, control costs, and deliver exceptional user experiences.
1. Faster Incident Detection and Resolution
Observability enables teams to identify anomalies early and pinpoint root causes faster by correlating telemetry across logs, metrics, traces, and profiles. This dramatically reduces Mean Time to Resolve (MTTR) and Mean Time to Detect (MTTD), minimizing service disruptions.
Organizations adopting mature observability practices frequently report MTTR improvements of 25% or more, enabling engineering teams to restore services faster and with greater confidence.
2. Improved System Reliability and Uptime
Real-time visibility into system health allows teams to resolve issues before they escalate into outages. Instead of reacting to failures, engineers can proactively stabilize infrastructure and improve Mean Time Between Failures (MTBF).
The result is more resilient applications and consistent service availability, both critical for customer trust.
3. Higher Developer Productivity
Developers often spend a significant portion of their time debugging production issues. Observability reduces this burden by delivering actionable insights instead of fragmented alerts.
“Developers spend nearly 50% of their time debugging. Observability has the potential to bring that down to nearly 10%.”
Sam Suthar, Founding Director at Middleware
With faster troubleshooting, teams can focus more on innovation and shipping features rather than firefighting.
“I don’t want my developers to stay up all night to try to fix issues. That’s a waste of everyone’s time. Middleware helped us become faster. It saves at least one hour of my time every day, which I can dedicate to something else.”
Akshat Gupta, Trademarkia.
As environments grow more complex, manually building dashboards can slow investigations and increase operational overhead. AI-powered dashboard builders help address this by allowing engineers to generate interactive dashboards using simple prompts.
For example: “Build a dashboard for my Kubernetes clusters in US-East that correlates memory leaks with recent GitHub deployments.”
Within seconds, teams gain a unified view of relevant telemetry, reducing setup time and enabling faster troubleshooting. Instead of spending hours configuring visualizations, developers can focus on identifying root causes and improving system reliability.
👉 Learn more about Middleware’s AI Dashboard Builder.
4. Lower Cloud and Monitoring Costs
Telemetry without a strategy quickly becomes expensive. Observability helps organizations control costs by identifying unused resources, reducing metric cardinality, and eliminating redundant tooling.
See how Middleware helped Generation Esports slash observability costs & improve MTTR by 75%!
Modern platforms increasingly use observability pipelines to process telemetry before ingestion, filtering low-value data, deduplicating repetitive signals, and routing critical information to the appropriate storage tiers. This approach reduces data volume, improves signal clarity, and helps teams optimize monitoring spend without sacrificing visibility.
👉 Explore how the Middleware Observability Pipeline helps teams optimize telemetry flow and control costs.
5. Stronger Security Visibility
Observability enhances security by providing deep insight into system behavior, making it easier to detect unusual activity, vulnerabilities, and potential threats.
When telemetry is analyzed continuously, security teams can respond faster, strengthen compliance posture, and reduce organizational risk.
6. Better Customer and User Experience
Performance issues directly impact revenue and brand perception. Observability tools, especially those with Real User Monitoring (RUM), allow teams to understand how applications behave from the user’s perspective.
By detecting latency, errors, and frontend bottlenecks early, organizations can resolve friction before customers are affected.
7. AI-Ready Infrastructure
As AI-driven applications generate massive volumes of telemetry, observability is becoming essential for monitoring model behavior, infrastructure usage, and system performance.
AI-assisted observability further improves operations by automating anomaly detection and accelerating root cause analysis, enabling teams to manage complexity at scale.
To support this shift, platforms like Middleware’s LLM Observability provide real-time visibility into AI workloads, helping organizations optimize performance and maintain reliability.
👉 Learn more about LLM Observability.
“Teams rarely struggle with observability because of tooling they struggle because they collect vast amounts of telemetry without defining what healthy system behavior looks like. Effective observability begins with clarity, not volume.”
What is the Real Advantage of Using Observability?
The benefits of observability extend far beyond basic system visibility. Organizations that adopt full-stack observability consistently report measurable operational and financial improvements.
- Nearly 35.7 % experienced MTTR and MTTD improvements.
- Almost half the companies using full-stack observability were able to lower their downtime costs to less than $250k per hour.
- More than 50% of companies were able to address outages in 30 minutes or less.
- Additionally, companies with full-stack observability or mature observability practices have gained high ROIs. In fact, 71% of organizations see observability as a key enabler to achieving core business objectives.
- As of 2025, the median annual ROI for observability stands at 100%, with an average return of $500,000.
Simply put, observability is no longer just an engineering investment; it is a strategic business advantage that drives resilience, efficiency, and revenue protection.
Real-World Observability Examples from High-Scale Engineering Teams
High-scale companies treat observability as a strategic capability. Observability has grown from a specialized engineering task to a key part of modern software operations.
Here are global companies showing top observability strategies, each designed for their size, systems, and customer experience goals.
1. Netflix: Chaos Engineering at Scale
Netflix uses observability alongside chaos engineering to intentionally test system failures and ensure service resilience. By simulating outages, their teams identify weaknesses early and strengthen infrastructure before users are impacted.
Key takeaway: Netflix uses observability not just for monitoring but for proactively testing system failure tolerance.
2. Meta (formerly Facebook): High-Scale Distributed Tracing
Meta combines open-source and proprietary tooling to monitor highly distributed services in real time. This approach provides engineers with deep visibility into system behavior and helps maintain performance for billions of users.
Key takeaway: Mature observability requires unified visibility across complex, global architectures to achieve high performance in distributed systems.
3. Uber: Real-Time System-Level Insights
Uber depends on real-time telemetry to maintain uptime and accuracy across millions of rides. Observability allows teams to quickly detect anomalies, trace requests, and ensure platform stability during peak demand.
Key takeaway: Real-time visibility is critical for systems where delays directly impact customer experience.
4. Airbnb: Optimizing the Guest Experience
Airbnb uses observability to monitor service health, detect booking flow issues, and resolve performance bottlenecks before they affect hosts or guests. This proactive approach helps maintain trust in their platform.
Key takeaway: Observability directly influences customer satisfaction and revenue, improves user experience, and solves system issues before they impact bookings.
How can Observability Benefit DevOps and Engineers?
Observability goes far beyond collecting telemetry data. While access to logs, metrics, and traces is foundational, real value emerges when that data is transformed into actionable insights that improve both user experience and system reliability.
Open standards such as OpenTelemetry have accelerated cloud-native observability by providing a consistent framework for collecting and correlating telemetry across distributed environments. This unified visibility helps teams better understand application health regardless of infrastructure complexity.
Real User Monitoring (RUM) provides real-time insight into customer experiences by mapping request journeys and service interactions. Whether through synthetic testing or recorded sessions, teams can monitor APIs, third-party dependencies, browser errors, user behavior, and performance bottlenecks.
For instance, Hotplate, a popular food delivery platform, leveraged Middleware’s observability solution to ensure seamless customer experiences during peak hours. By gaining real-time visibility into their application’s performance, Hotplate’s team quickly identified and resolved issues, resulting in a 90% reduction in errors and a significant improvement in customer satisfaction.
With Middleware’s observability solution, Hotplate was able to deliver fast, reliable, and secure food delivery experiences to its customers, even during the busiest times.
With end-to-end visibility into system health and request paths, DevOps, SRE, and DevSecOps teams can:
- Detect issues earlier
- Accelerate root-cause analysis
- Reduce alert fatigue
- Recover from failures faster
- Improve deployment confidence
The result is a more proactive engineering culture focused on reliability rather than firefighting.
Can AI make Observability better?
Artificial intelligence is not a magic solution, but when applied thoughtfully, it significantly enhances observability capabilities.
Modern systems generate enormous volumes of telemetry data, making manual debugging slow, expensive, and error-prone. AI-powered observability helps teams cut through the noise by automatically identifying patterns, anomalies, and probable root causes.
By combining AIOps with observability, organizations can:
- Automate anomaly detection
- Group related logs intelligently
- Accelerate root-cause analysis
- Identify previously unknown failure patterns
- Reduce developer time spent on debugging
AI-driven insights enable teams to shift from reactive troubleshooting to proactive incident prevention.
“Want to know where your organization stands on its observability journey? Explore our Observability Maturity Model to assess your current capabilities, identify gaps, and map a clear path toward full-stack observability.”
The emergence of Generative AI is pushing this even further. Advanced models can surface relevant telemetry signals, highlight risk areas, and recommend remediation steps, simplifying access to critical insights and improving operational decision-making.
As automation becomes more intelligent, AI is redefining the future of system reliability and performance engineering.
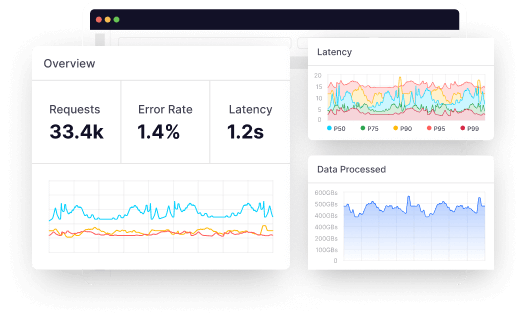
Example: Middleware Observability Platform
Middleware is a full-stack cloud observability platform that empowers developers and organizations to monitor, optimize, and streamline their applications and infrastructure in real-time.
By consolidating metrics, logs, traces, and events into a single platform, users can effortlessly resolve issues, enhance operational efficiency, minimize downtime, and reduce observability costs.
Middleware also introduces an AI-powered dashboard builder that lets teams create full dashboards using plain-English prompts, accelerating analysis and reducing manual configuration.
Middleware provides comprehensive observability capabilities, including infrastructure, log, application performance, database, synthetic, serverless, container, and real user monitoring.
With its scalable architecture and extensive integrations, it helps organizations optimize their technology stack and improve efficiency. Many businesses have seen significant benefits, including a 10x reduction in observability costs and a nearly 75% improvement in operational efficiency.
“Middleware has proven to be a more cost-effective and user-friendly alternative to New Relic, enabling us to capture comprehensive telemetry across our platform. This improved our operational efficiency, service delivery, and accelerated incident root cause analysis.”
John D’Emic, Co-Founder and CTO at Revenium.
Continuous Profiling with Middleware
Middleware’s Continuous Profiler provides always-on, low-overhead profiling for modern applications. It gives engineers real-time visibility into CPU, memory, and code execution patterns and seamlessly correlates profiling data with traces and logs in a unified timeline.
With Middleware, teams can:
- Identify performance bottlenecks at the function level
- Reduce cloud costs by optimizing inefficient code paths
- Catch regressions early during deployments
- Improve application performance without manual profiling sessions
👉 Explore how Middleware’s Continuous Profiler helps teams ship faster, more efficient software with confidence.
Observability Challenges in 2025
If observability delivers such strong operational and business benefits, what prevents organizations from fully embracing it? Despite rapid adoption, several challenges continue to slow maturity.
Rising Costs
Observability can become expensive when telemetry data grows unchecked. In fact, nearly 80% of companies reported pricing or billing challenges with their observability vendors in recent years. Without proper data controls, organizations risk paying for large volumes of low-value data.
Data Overload and Alert Fatigue
Modern systems generate massive streams of logs, metrics, and traces. When every signal triggers an alert, critical insights get buried in noise, leading to alert fatigue, slower response times, and higher storage costs.
“Excessive data collection has led to inflated costs without real value. Customizable observability platforms now enable companies to flag and filter unnecessary data, reducing expenses without sacrificing insights. By implementing comprehensive data processing with compression and indexing, companies can significantly reduce data size, leading to cost savings. This approach is expected to save companies 60-80% on observability costs, shifting from exhaustive data collection to efficient, targeted monitoring.”
Sam Suthar, Founding Director at Middleware.
Organizational Silos
Infrastructure, development, operations, and business teams often operate independently, using separate tools and datasets. These silos create communication gaps and limit the shared visibility required for faster incident resolution.
From Correlation to Causation
Identifying that something is wrong is no longer enough; organizations must understand why it happened and what business impact it creates. Connecting technical signals to real business outcomes remains one of the toughest observability challenges today.
The Future of Observability
Observability is quickly evolving from a monitoring practice into a strategic engineering capability.
As organizations modernize their technology stacks, the industry is shifting away from legacy monitoring toward full-stack, intelligent observability built for distributed and cloud-native environments. Industry projections indicate that more than 80% of enterprises plan to expand their observability capabilities through 2026, signaling a major shift in how reliability is managed.
Several trends are shaping the next phase of observability:
AI-Native Observability
Artificial intelligence is becoming foundational to modern platforms. AI-driven systems can unify telemetry data, detect anomalies earlier, automate root-cause analysis, and surface actionable insights, helping teams move from reactive troubleshooting to predictive operations.
Natural Language Interfaces and LLMs
Observability platforms are increasingly adopting natural language interfaces powered by Large Language Models (LLMs). This allows engineers and even non-technical stakeholders to query system behavior conversationally, lowering the barrier to insight and accelerating decision-making.
Observability for AI-Driven Systems
As AI-generated code and autonomous systems proliferate, organizations will need more flexible, disaggregated observability architectures that can handle dynamic workloads and unpredictable system behavior.
“Observability in 2025 is evolving fast, don’t let your strategy fall behind. Explore our complete Observability 2.0 Guide”
Greater Data Ownership and Cost Control
The commoditization of observability tooling is giving organizations more leverage. Companies now prioritize platforms that provide greater control over telemetry data, transparent pricing, and flexible ingestion strategies to prevent runaway costs.
Platforms like Middleware are driving this shift by combining AI-powered insights with unified telemetry, enabling teams to maintain visibility, control data growth, and act on issues faster.
Turn Trends Into Action
See how Middleware helps teams adopt AI-powered, cost-optimized observability. Start your free trial →
FAQs
What do you mean by observability?
Observability is the ability to understand a system’s internal state by analyzing the data it produces, including logs, metrics, traces, and events. By collecting and correlating telemetry data from applications and infrastructure, teams can quickly detect issues, identify root causes, and maintain system reliability.
What is Cloud Observability?
Cloud observability is the ability to monitor, analyze, and understand cloud systems in real time using logs, metrics, and traces to detect, diagnose, and resolve issues quickly.
Why is observability important in modern systems?
Observability helps teams detect, diagnose, and resolve system issues faster by providing real-time insights into performance and behavior.
What are the three pillars of observability?
The three key pillars are logs, metrics, and traces, collectively known as the telemetry data.
How do I implement observability?
Observability is implemented by instrumenting applications and infrastructure to collect telemetry data and centralizing it using open standards like OpenTelemetry or a unified observability platform.
What are some observability tools?
Common observability tools include Middleware, Datadog, Splunk, Dynatrace, Prometheus, Grafana, and OpenTelemetry, which help monitor, analyze, and optimize system performance.
What are the 4 golden signals of observability?
The four golden signals are latency, traffic, errors, and saturation, which indicate service health and help teams detect performance issues early.
What is the difference between monitoring and observability?
Monitoring shows what is failing using predefined alerts, while observability explains why it failed by enabling deeper analysis across distributed systems.